
Introduction
UCITS III hedge funds have continued to post significant gains through 2011, both in terms of assets under management (AuM) and the total number of funds. As at end-August 2011 we estimate there to be 740 unique managers[1] with assets of nearly US$200 billion.
Figure 1: Industry growth since 2007

As shown in figure 2, UCITS III hedge funds have attracted proportionally greater asset flows when compared to the global hedge funds sector over the last two and a half years. Since 2008 against the backdrop of the financial crisis and some high profile frauds, hedge funds subscribing to the UCITS III framework have become increasingly popular as investors sought greater transparency, better risk management and more regulations from managers.
Figure 2: Growth of UCITS hedge funds relative to global hedge funds (%)

Launches and closures
Figures 3a and 3b show the fund launches and fund closures in global hedge funds and UCITS III hedge funds. In this figure all share classes are included to display comparative growth and attrition figures. Since the start of 2009, the total number of new hedge funds launched globally is 1696 while 797 UCITS III compliant hedge fund vehicles were launched.
Although launch activity in global hedge funds picked up since Q3 2009, the growth in UCITS III hedge fund population has been significantly greater. The main drivers of this growth are existing hedge funds launching UCITS III compliant versions of their funds and mutual fund companies launching hedge fund-like products. For existing hedge fund managers, a UCITS III version of their funds offers them a way to address investor concerns and are also an avenue to target new capital from European institutions as well as retail investors. On the other hand, mutual fund companies have utilised the flexibility within the UCITS III framework to offer products that can generate better risk adjusted returns. In addition, some hedge fund management companies have made wholesale changes to bring their operations within the UCITS III regulatory framework.
Figures 3a-3b-3c: Global and UCITS III hedge funds launches and closures


Geographic mandates
The breakdown of assets in UCITS III hedge funds by their geographic investment mandates are displayed in figures 4a and 4b. The main trend observed over the last few years is the decrease in the proportion of assets managed by funds allocating only to Europe. Although the region still accounts for 41.3% of UCITS III hedge fund assets, this share has decreased from 49.3% in August 2007. Funds allocating to other regions have grown to account for 10% of the assets while those with a global mandate have maintained most of their share.
Figures 4a-4b: Geographic mandates by AuM
 |  |
Head office locations
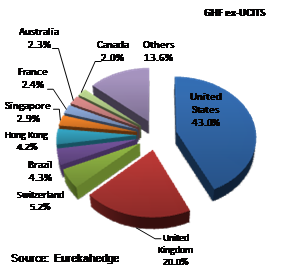
Figures 5a and 5b compare the head office locations of global hedge funds and UCITS III hedge funds. Nearly 90% of UCITS III funds are based out of Europe, compared to only 35% of global (non-UCITS) hedge funds, indicating that UCITS is a vehicle for managers to target European institutional capital. While it is no surprise that most UCITS III hedge funds are based out of Europe, North America now accounts for 10% of the funds implying that the regulation is now becoming popular with American investors as well. Within Europe, the United Kingdom dominates as the location of choice, accounting for 47.7% of UCITS III funds and 20% of global hedge funds as it offers ready access to investors as well as service providers.
Figures 5a-5b: Head office locations of UCITS hedge funds vs. global hedge funds
 |  |
Strategic mandates
In terms of strategic mandates, long/short equities continue to dominate the UCITS landscape accounting for 37% of assets. However assets in fixed income funds have increased to account for 30.1% of the total which reflects the lower risk appetite of European investors during the last two years. While the share of other investment strategies has also increased, it remains much lower than what is seen in global hedge funds.
Figures 6a-6b: Comparison of GHF and UCITS hedge fund strategies
 |  |
Performance review
Figure 7 compares the performance of UCITS III hedge funds, global hedge funds, funds of funds and the equity markets; represented by the MSCI World Index. Over the last five and a half years the Eurekahedge UCITS Hedge Fund Index has gained 22.25%. This compares favourably with the performance of equities and funds of funds which recorded returns of 2.64% and 9.80% respectively over the same period of time. However, UCITS hedge funds underperformed global hedge funds as compliance to the regulatory framework requires managers to maintain liquidity and low levels of leverage – thereby limiting their upside potential. The Eurekahedge Hedge Fund Index was up 51.60%, over twice the return of UCITS compliant hedge funds.
Figure 7: Performance of UCITS hedge funds with other investment vehicles since 2005

Figure 8: Performance of UCITS hedge funds across strategies

Figure 8 and table 1 display the performance of UCITS III hedge funds by strategic mandates since August 2008. From August 2008 to August 2009, macro investing managers achieved the best returns of 9.35% as diversified portfolios and liquidity regulations enabled them to limit their losses and exit underperforming holdings. In the following 12 months from August 2009 to August 2010, almost all UCITS strategies finished with net gains, with the exception of multi-strategy and relative value managers. M&A activity was on the rise and event driven managers topped returns with a 4.76% yearly gain. As global markets softened during the last 12 months due to rising concerns about European sovereign debt, CTA managers delivered the best performance; up 6.34% amid gains in the commodities sector.
Table 1: Performance of UCITS hedge funds across strategies
Arbitrage
|
CTA/
managed futures |
Event driven
|
Fixed income
|
Long/short equities
|
Macro
|
Multi-strategy
|
Others
|
Relative value
| |
2011 YTD returns
|
-0.67%
|
0.10%
|
-1.50%
|
-1.55%
|
-5.26%
|
-4.77%
|
-1.63%
|
-4.15%
|
-5.45%
|
12 month returns
|
0.60%
|
6.34%
|
-0.14%
|
-0.18%
|
0.33%
|
-2.63%
|
2.94%
|
1.52%
|
-5.29%
|
3 year annualised returns
|
1.52%
|
-2.88%
|
1.49%
|
2.17%
|
1.52%
|
3.05%
|
2.05%
|
1.46%
|
-1.55%
|
Source: Eurekahedge
In terms of regional mandates, Asia ex-Japan managers have been the best performers over the last three years while North American managers have delivered the best returns in the shorter term. In fact, North American funds were in positive territory for the year until July 2011 (up +2.45% July YTD). Despite that, managers lost 4.19% on average in August due to sharp market declines in August. Similarly, Asia ex-Japan managers experienced a 9.16% month-on-month loss in August which effectively negated their 2011 gains. In the last 12 months, Asia ex-Japan funds witnessed gains of 4.75% and have delivered an impressive 24.97% total return over the last three years. Hedge funds leveraged upon the strong economic recovery in Asia by going long on Asian assets which included currencies, corporate debt and equities; all of which locked in net gains by the end of three years. In contrast, the MSCI AC Asia Pacific Index was higher by 2.08% in three year total return terms.
Figure 9: Performance of UCITS hedge funds across geographic mandates

Table 2: Performance of UCITS hedge funds across geographic mandates
Asia ex-Japan
|
Europe
|
Global
|
Japan
|
Latin America
|
North America
| |
2011 YTD returns
|
-7.87%
|
-5.47%
|
-3.43%
|
-6.03%
|
-13.94%
|
-1.84%
|
12 month returns
|
4.75%
|
-0.83%
|
0.96%
|
3.68%
|
-0.57%
|
6.58%
|
3 year annualised returns
|
7.71%
|
0.74%
|
1.23%
|
-4.20%
|
3.79%
|
2.07%
|
Source: Eurekahedge
No comments:
Post a Comment