Introduction
Despite an environment of increasing uncertainty in the markets, the global hedge funds sector has witnessed some strong trends in the first half of 2011. Chief among these trends: the industry attracted record inflows in the first 6 months of the year. As of end-June 2011, the size of the industry currently stands at US$1.81 trillion.
At the start of 2000, total industry assets stood at US$277 billion and over the next seven years, the sector witnessed tremendous growth to reach US$1.95 trillion; a seven-fold increase. However, the growth trend reversed in 2008 amid the credit crunch, collapse of large financial institutions, high-profile frauds and the subsequent financial crisis. The drying up of liquidity, heightened risk aversion and resultant widespread redemptions culminated in the worst yearly performance for the industry and the Eurekahedge Hedge Fund Index lost 10.63% in 2008. Additionally, performance-based losses led to further negative asset flows which resulted in greater losses as managers were forced to sell potentially winning positions. The industry reached its nadir in April 2009, with AuM falling to US$1.29 trillion – a drawdown of 33%.
Figure 1: Industry growth since 2000
Since the start of the recovery phase in 2009, the industry has posted excellent growth both through performance as well as assets flows. The Eurekahedge Hedge Fund Index gained 34.6% in the period between February 2009 and June 2011, while total AuM increased by more than US$500 billion between April 2009 and June 2011.
|
Source: Eurekahedge
|
Asset flows
The sector has witnessed substantial asset flows since May 2009, while also posting excellent performance-based growth. Total assets in the industry increased from US$1.289 trillion in April 2009 to US$1.81 trillion by end-June 2011, gaining a total of US$521.6 billion. Table 1 gives a breakdown of industry asset growth by performance-based growth and net asset flows since the start of 2009.
In the last eight months of 2009 the sector attracted more than US$78 billion. However, this was not enough to offset the heavy redemptions seen in the first four months of the year, resulting in net negative assets flows for the full year. On the other hand, these negative flows were offset by the US$131.5 billion growth through performance as the Eurekahedge Hedge Fund Index was up 20.41% in 2009.
Table 1: Monthly asset flows in global hedge funds
Month
|
Net Growth (Performance)
|
Net Flows
|
Assets at end
|
Jan-09
|
7.0
|
(95.0)
|
1384.6
|
Feb-09
|
(4.0)
|
(28.5)
|
1352.1
|
Mar-09
|
0.3
|
(34.9)
|
1317.5
|
Apr-09
|
14.0
|
(42.7)
|
1288.8
|
May-09
|
35.3
|
3.0
|
1327.0
|
Jun-09
|
(0.8)
|
11.8
|
1338.1
|
Jul-09
|
19.4
|
4.0
|
1361.5
|
Aug-09
|
12.7
|
20.2
|
1394.3
|
Sep-09
|
24.8
|
23.3
|
1442.4
|
Oct-09
|
(1.1)
|
14.8
|
1456.2
|
Nov-09
|
14.8
|
8.3
|
1479.3
|
Dec-09
|
9.0
|
(7.1)
|
1481.2
|
2009
|
131.5
|
(122.9)
|
1472.5
|
Jan-10
|
(2.0)
|
(5.2)
|
1473.9
|
Feb-10
|
3.1
|
15.9
|
1493.0
|
Mar-10
|
26.2
|
1.7
|
1520.8
|
Apr-10
|
12.9
|
(1.0)
|
1532.7
|
May-10
|
(26.8)
|
0.9
|
1506.8
|
Jun-10
|
(2.1)
|
(1.6)
|
1503.0
|
Jul-10
|
13.1
|
10.4
|
1526.4
|
Aug-10
|
10.2
|
14.3
|
1550.9
|
Sep-10
|
32.7
|
14.1
|
1597.7
|
Oct-10
|
26.8
|
13.4
|
1637.9
|
Nov-10
|
(4.0)
|
(0.2)
|
1633.7
|
Dec-10
|
37.7
|
3.8
|
1675.1
|
2010
|
127.7
|
66.2
|
1675.1
|
Jan-11
|
1.6
|
18.3
|
1695.0
|
Feb-11
|
16.4
|
23.5
|
1734.9
|
Mar-11
|
0.9
|
23.8
|
1759.7
|
Apr-11
|
26.7
|
40.1
|
1826.5
|
May-11
|
(14.3)
|
7.9
|
1820.2
|
Jun-11
|
(16.1)
|
6.3
|
1810.4
|
Note: all figures are in US$ billion Source: Eurekahedge
Asset flows in the first half of 2010 were mixed, as fears regarding the European debt contagion spreading to other regions led to heightened risk aversion among investors. Despite this, consistent outperformance by hedge funds as well as improving market sentiment in the second half of the year resulted in increased asset flows to the sector. In the latter half of 2010, investors allocated more than US$55 billion through net asset flows to hedge funds globally while the total net flow for the year was US$66.2 billion.
The trend of strong inflows continued into the first half of 2011, with the sector gaining US$119.9 billion dollars - the strongest first six months on record. Despite increasing volatility in global markets, persisting concerns about the European debt situation and growing fears about the global economy, investors have continued to allocate capital to hedge funds in 2011 as the managers have previously displayed outperformance and downturn protection at times of heightened volatility.
An interesting correlation can be seen in Table 1 regarding a month’s negative performance and net redemptions in the following one or two months, and this is equally true for net inflows following months of strong positive performance returns. Figure 2 shows the 3-month moving average of net flows displaced by two months, plotted against the Eurekahedge Hedge Fund Index. This seems to suggest that investors have subscribed one to two months after periods of positive performance and redeemed two months after periods of negative performance, at corresponding magnitudes to the underlying performance. The movements in 2010 bear special significance as investors remained on the edge for most part of the year, hence the net flows seem to follow the index more closely. The trend of healthy inflows in 2011 has continued despite negative returns in the last few months and it seems that investor interest is going to persist – at least in the near term, regardless of performance.
Figure 2: Eurekahedge Hedge Fund Index vs. 3-month moving average net flows displaced by two months (US$ million)
Figure 3 compares the changes in AuM in hedge funds and funds of hedge funds. While hedge funds started growing after April 2009, the fund of hedge funds sector continued to witness withdrawals until July 2009 and has since remained more or less flat. This is primarily due to increased caution among investors when dealing with the multi-manager model after largely negative returns in 2008 and various high-profile scams such as the Madoff Ponzi scheme. With concerns over the exposure to fraudulent hedge funds, institutional and private investors are now more involved and meticulous in conducting due diligence rather than simply outsourcing to the fund of hedge funds manager. Additionally, they demand more transparency and communications from asset managers and are also directly investing in single-manager hedge funds as opposed to going through multi-managers.
Figure 3: AuM growth of funds of funds vs. hedge funds since January 2008
Fund sizes
In 2007 funds managing more than US$200 million made up 17% of the industry. Due to widespread redemptions as well as performance-based losses in 2008 and early 2009, the number of large hedge funds decreased by 7% while the number of funds with assets below US$50 million increased from 53% of the total industry to 65%. It should be noted that some of this increase was also due to new funds launched in 2008 to 2009 which failed to attract assets and hence remained in the lower brackets.
The predilection of investors to allocate assets to larger hedge funds (as discussed in the previous section) is also apparent in the breakdown of the industry according to fund sizes. In June 2009 funds with more than US$200 million in AuM accounted for 10% of the industry increasing to reach 15% over the last two years. Although most of the assets raised in the last two years have been allocated to larger hedge funds, small hedge funds have also managed to grow both by strong performance as well as through some allocations. The share of funds with less than US$20 million in assets has decreased from 42% of the total industry to 37%.
Figures 4a-4c: Industry breakdown of hedge funds by fund size (US$ million)
Geographic mandates
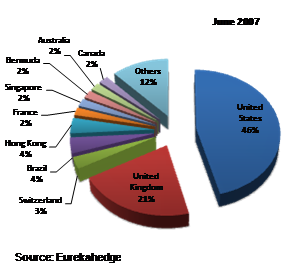
Looking at the distribution of global hedge fund assets by geographic investment mandate, we find that North American hedge funds account for two-thirds of the total assets invested in hedge funds. This is primarily due to the region being the oldest hedge fund centre in the world (the first hedge fund was launched in the US in 1949 by Alfred Winslow Jones), with the greatest number of investors, the most sophisticated financial market with the largest array of instruments and the largest service provider industry. Figures 5a-5c show the breakdown by geographic mandates at different points in time while Table 2 gives the regional asset flows over the last one and a half years.
Figures 5a-5c: Geographic mandates by AuM

The most significant change over the last four years in the breakdown of the hedge fund industry by geographic investment mandate is the 4% increase in assets invested in North American funds which can be attributed to strong net positive asset flows witnessed by regional managers since mid-2009. It is hardly surprising that North American hedge funds gained the lion’s share of investor allocations since the region accounts for the largest chunk of assets in the industry; US$1.21 trillion out of US$1.81 trillion, as well as being home to a large pool of hedge fund investors such as family offices, pension funds and high-net-worth individuals. Regional hedge funds gained US$136.3 billion through net subscriptions alone over the last one and a half years witnessing 17 straight months of net positive asset flows. This accounts for 75% of the total asset flows into global hedge funds and is proportionally greater than the share of North American hedge fund assets in the overall global industry.
Table 2: Monthly asset flows across regions (US$ billion)
|
Asia ex-Japan
|
Japan
|
Europe
|
Latin America
|
North America
|
Jan-10
|
(0.5)
|
(0.1)
|
(2.0)
|
0.1
|
(2.6)
|
Feb-10
|
(0.8)
|
0.1
|
(1.6)
|
0.1
|
17.5
|
Mar-10
|
0.3
|
(0.4)
|
1.1
|
0.6
|
0.3
|
Apr-10
|
(0.3)
|
(0.1)
|
(1.8)
|
0.2
|
1.5
|
May-10
|
0.2
|
0.5
|
(5.7)
|
(0.5)
|
6.5
|
Jun-10
|
(0.4)
|
0.8
|
(3.2)
|
0.3
|
1.3
|
Jul-10
|
(0.1)
|
0.6
|
8.4
|
0.6
|
1.7
|
Aug-10
|
0.2
|
0.2
|
(0.6)
|
0.5
|
15.0
|
Sep-10
|
0.2
|
0.2
|
7.7
|
1.0
|
4.9
|
Oct-10
|
1.7
|
0.2
|
4.9
|
0.9
|
6.6
|
Nov-10
|
1.0
|
(0.3)
|
(3.7)
|
(0.0)
|
3.5
|
Dec-10
|
0.6
|
0.2
|
0.5
|
1.1
|
1.4
|
2010
|
2.1
|
1.9
|
4.0
|
4.9
|
57.6
|
Jan-11
|
0.4
|
(0.2)
|
6.0
|
(0.1)
|
11.9
|
Feb-11
|
1.6
|
0.0
|
7.0
|
0.4
|
14.1
|
Mar-11
|
0.0
|
0.2
|
7.2
|
0.5
|
15.8
|
Apr-11
|
1.0
|
0.2
|
12.3
|
0.8
|
25.7
|
May-11
|
1.8
|
0.3
|
(2.0)
|
(0.1)
|
8.0
|
Jun-11
|
0.4
|
0.2
|
(1.2)
|
(0.2)
|
3.2
|
YTD
|
5.2
|
0.8
|
29.2
|
1.4
|
78.7
|
Source: Eurekahedge
Strategic mandates
Table 3 shows the net assets flows across the different strategic mandates since January 2010.
Table 3: Monthly asset flows across strategies (US$ billion)
|
Arbitrage
|
CTA/ Managed Futures
|
Distressed Debt
|
Event Driven
|
Fixed Income
|
Long / Short Equities
|
Macro
|
Multi-Strategy
|
Relative Value
|
Others
|
Jan-10
|
(5.1)
|
(1.7)
|
1.3
|
1.8
|
(0.6)
|
(2.2)
|
0.0
|
1.5
|
(0.0)
|
(0.4)
|
Feb-10
|
1.2
|
(6.1)
|
8.3
|
1.5
|
0.3
|
8.4
|
0.4
|
1.7
|
0.2
|
(0.1)
|
Mar-10
|
0.7
|
(1.8)
|
(0.8)
|
4.0
|
(0.2)
|
2.0
|
0.8
|
(3.5)
|
0.7
|
(0.1)
|
Apr-10
|
(0.2)
|
(0.1)
|
(0.1)
|
0.1
|
(0.0)
|
(1.0)
|
(0.2)
|
0.0
|
0.2
|
(0.0)
|
May-10
|
0.3
|
(0.4)
|
0.0
|
0.4
|
0.0
|
0.8
|
(0.3)
|
0.1
|
(0.1)
|
0.0
|
Jun-10
|
(0.5)
|
(0.4)
|
(1.8)
|
0.2
|
0.0
|
1.7
|
0.3
|
(1.4)
|
0.1
|
(0.0)
|
Jul-10
|
(2.2)
|
0.4
|
(1.0)
|
3.3
|
3.5
|
7.3
|
1.0
|
(3.0)
|
1.6
|
(0.5)
|
Aug-10
|
4.5
|
(0.3)
|
(0.6)
|
0.5
|
2.4
|
1.3
|
1.1
|
5.1
|
0.8
|
(0.5)
|
Sep-10
|
1.6
|
(2.1)
|
0.1
|
2.0
|
2.1
|
6.6
|
1.1
|
1.3
|
1.1
|
0.3
|
Oct-10
|
0.6
|
2.9
|
(1.7)
|
(2.4)
|
2.1
|
9.5
|
4.0
|
(3.2)
|
1.6
|
0.1
|
Nov-10
|
0.0
|
0.0
|
0.0
|
(0.0)
|
0.2
|
(0.0)
|
0.1
|
(0.4)
|
0.0
|
(0.0)
|
Dec-10
|
(0.1)
|
2.0
|
(2.6)
|
(0.3)
|
0.9
|
(1.1)
|
2.7
|
(0.2)
|
0.6
|
1.8
|
2010
|
0.8
|
(7.6)
|
1.1
|
11.3
|
10.8
|
33.4
|
11.0
|
(1.9)
|
6.9
|
0.6
|
Jan-11
|
(0.1)
|
3.4
|
0.2
|
1.4
|
0.7
|
9.6
|
0.7
|
(2.1)
|
2.2
|
2.4
|
Feb-11
|
2.6
|
4.1
|
(2.0)
|
3.7
|
2.4
|
6.9
|
4.0
|
(0.3)
|
1.8
|
0.3
|
Mar-11
|
1.8
|
3.6
|
0.6
|
4.3
|
2.8
|
4.3
|
1.8
|
2.6
|
0.9
|
1.3
|
Apr-11
|
1.6
|
4.0
|
(0.2)
|
4.3
|
4.3
|
13.2
|
3.6
|
5.4
|
1.5
|
2.4
|
May-11
|
1.5
|
1.3
|
0.5
|
2.4
|
0.6
|
(0.9)
|
2.1
|
(0.4)
|
(0.4)
|
1.2
|
Jun-11
|
1.4
|
2.0
|
0.4
|
0.8
|
(0.1)
|
(2.7)
|
1.5
|
(1.5)
|
0.5
|
0.2
|
YTD
|
8.7
|
18.3
|
(0.5)
|
17.0
|
10.6
|
30.4
|
13.6
|
3.8
|
6.7
|
7.7
|
Source: Eurekahedge
Over the last year and a half, long/short equity funds have attracted the greatest amount of capital from investors, gaining US$63.7 billion. Reasons for this strong asset flow include the availability of long/short funds, the healthy performance of long/short equity managers in 2009 and 2010, and the strong rebound in equity markets which effectively convinced investors of the opportunity offered by hedge funds in the equity space during economic recovery phases.
These factors aside, long/short equity managers have lost 9% of their share since June 2007 (as can be seen in Figures 6a-6c), primarily due to aggressive sell-off in underlying markets in 2008 and the volatile performance of long/short funds. Additionally in 2008, the strategy accounted for the largest net outflows of US$51 billion as investors withdrew large amounts of capital from the industry. Subsequently, since 2009 investors have preferred to diversify their capital away from long/short equity funds and into other strategies such as CTA and event driven hedge funds, which increased by 3% and 5% respectively in the four-year period. In addition to increased capital flow, CTAs and event driven managers have also increased their share in hedge fund assets through performance-based gains. In 2008, CTA managers were up 17.98% at a time when most other hedge fund strategies suffered significant losses. Similarly, managers employing the event driven mandate have witnessed excellent returns in 2009 and 2010, gaining 38.12% and 15.40% respectively.
Figures 6a-6c: Strategic mandates by AuM
Head office locations & fund domiciles
Figures 7a and 7b illustrate the breakdown of the hedge fund population by funds’ head office locations as at mid-2011. Figure 7b shows that even though its share has been decreasing over the last few years (as other hedge fund centres witnessed more fund launches), the US continues to be the dominant hedge fund centre and is home to 39% of the global hedge fund population. UK-based hedge funds, and those based in other European countries, have significantly increased their share of the pie recently due to the rapid growth of UCITS III hedge funds after 2008. UCITS hedge funds are regulated structures run within an EU framework, running hedge fund strategies. Given the demand for greater regulation in the industry, they have become extremely popular among investors. Furthermore, since the framework also allows for these funds to be marketed across different countries within the EU and to retail clients, the regulation has attracted a significant number of hedge fund management companies to launch their UCITS funds. This reason also accounts for the change in the split of hedge fund domiciles as seen in Figure 8, with the Cayman Islands losing substantial share.
Figures 7a-7b: Head office locations by number of funds
Figure 8: Fund domiciles by number of funds
Launches and closures
The global financial crisis had led to a spike in attrition rates across hedge funds. In 2008, the number of fund closures exceeded the number of launches for the first time in the industry’s history. The trend of attrition continued into 2009 with the first two quarters witnessing a greater number of closures as opposed to launches. The launch activity in global hedge funds however, has picked up since the last quarter of 2009 with the first half of 2010 and 2011 witnessing a number of new launches reach pre-crisis levels. The last 18 months have seen the launch-liquidation ratio improve as the industry saw a healthy number of hedge fund start-ups by managers aiming to exploit the attractive valuations and other opportunities available in the markets. The current strong launch activity remains at par with historical levels of healthy growth.
Figure 9: Launches and closures across the global hedge fund industry from 2007 to 2Q 2011
High water mark
Figure 10 tracks the percentage of funds that are above their high-watermarks since December 2008.
Figure 10: Percentage of hedge funds worldwide exceeding their high-watermark
To determine if funds are above their high-water marks their net asset values (NAVs) are compared to their December 2007 level, assuming that managers have attracted some assets since then. The historical NAV high is not used for analysis since the high-water mark differs from investor to investor, depending on NAV level at the time of capital allocation.
In December 2008, only 36% of the managers were above their respective high-watermarks. As the global markets entered into recovery phase, the number of managers earning their performance fees also increased and as at end-June 2011, 52% of the managers remain above their high-watermarks.
Fees
The fee structures of hedge funds have changed over the last few years to reflect the fortunes of the industry as shown in Table 4. While the average management fees of hedge fund launches have not changed significantly as they are reasonable and competitive with fees charged by other investment vehicles such as mutual funds, the average performance fees of hedge funds have seen some changes.
Before 2008, average performance fees remained above 19% for most part of the decade. However it was only after the financial downturn that managers responded to calls from investors to lower their performance fees. This average fell to 17.61% in 2009 as managers vied to raise capital from sceptical investors. Funds launched in 2010 & 2011 have a higher average, suggesting that managers launching new funds are confident about asset-raising as well as their abilities to generate positive returns in different market conditions in the future.
Table 4: Average hedge fund fees by launch year
Year
|
Performance Fees (%)
|
Management Fees (%)
|
2000
|
19.53
|
1.46
|
2001
|
19.61
|
1.48
|
2002
|
19.70
|
1.60
|
2003
|
18.61
|
1.53
|
2004
|
19.56
|
1.61
|
2005
|
19.73
|
1.71
|
2006
|
19.02
|
1.65
|
2007
|
19.32
|
1.74
|
2008
|
18.84
|
1.65
|
2009
|
17.61
|
1.64
|
2010
|
18.46
|
1.56
|
June YTD
|
18.36
|
1.76
|
Source: Eurekahedge
Prime brokers
Table 5a-5b: Top prime brokers by market share
Dec-07
|
Prime Broker
|
Share
|
Morgan Stanley
|
20.03%
|
Goldman Sachs
|
18.48%
|
Bear Stearns
|
14.71%
|
UBS
|
7.82%
|
Deutsche Bank
|
5.87%
|
Citigroup
|
4.18%
|
Credit Suisse
|
4.03%
|
Lehman Brothers
|
3.58%
|
Merrill Lynch
|
2.89%
|
Bank of America
|
2.45%
|
Others
|
15.96%
|
|
Jun-11
|
Prime Broker
|
Share
|
Goldman Sachs
|
17.40%
|
Morgan Stanley
|
16.35%
|
JP Morgan
|
14.45%
|
Deutsche Bank
|
8.98%
|
UBS
|
8.37%
|
Credit Suisse
|
8.28%
|
Citibank
|
5.00%
|
BofA - Merrill Lynch
|
3.56%
|
Newedge
|
3.22%
|
Barclays
|
2.75%
|
Others
|
11.65%
|
|
Source: Eurekahedge Source: Eurekahedge
The distribution of hedge fund assets across the different prime brokers has also witnessed significant changes over the last four years. Tables 5a and 5b illustrate the share of prime brokers in 2007 and 2011. The most important trend to be noted is the share of the top three prime brokers decreased from more than 53% in 2007 to 48% as at June 2011. This is a result of a) increasing competition among the prime brokers with several of the larger investment banks dramatically intensifying their prime brokerage marketing, and b) hedge funds diversifying their prime broker relationships to multiple institutions, rather than relying on only one prime broker in the wake of the Lehman crash.
It should be noted that the share of ’Others’ has decreased as hedge funds have moved their prime broker relationships to the larger institutions as a way of managing their counter-party risk. Additionally, JP Morgan and Barclays have also joined the top 10 prime brokers club through their acquisitions of Bear Stearns and Lehman Brothers respectively.
Administrators
The hedge fund administration landscape has also moved towards consolidation by larger, more well-known administrators, similar to the changes in the prime broker industry. This is in fact a direct result of the fall-out from the Madoff Ponzi scheme as no investor will now consider investing in a fund that does not have reputed third-party administrators. As such the share of ‘Others’, which includes funds with internal administration, as well as small and relatively unknown administrators, has dropped by more than 14% over the last three years. In the wake of the financial crisis, the heightened stress on regulations that hedge funds must adhere to has also mandated that they employ recognised third-party administrators.
Table 6a-6b: Top administrators by market share
Dec-07
|
Administrator
|
Market Share
|
CITCO
|
12.41%
|
HSBC
|
9.47%
|
Citigroup
|
5.39%
|
Bank of New York
|
3.45%
|
State Street
|
2.97%
|
GlobeOp
|
2.59%
|
Northern Trust
|
2.36%
|
PFPC
|
2.31%
|
Morgan Stanley
|
2.30%
|
Goldman Sachs
|
2.25%
|
Others
|
54.50%
|
|
Jun-11
|
Administrator
|
Market Share
|
CITCO
|
12.34%
|
State Street
|
8.06%
|
HSBC
|
7.79%
|
Citigroup
|
5.68%
|
GlobeOp
|
5.64%
|
Custom House
|
5.39%
|
BNY Mellon
|
5.38%
|
Prime Fund Solutions
|
3.63%
|
RBC Dexia
|
3.37%
|
Goldman Sachs
|
2.71%
|
Others
|
40.02%
|
|
Source: Eurekahedge Source: Eurekahedge
Performance review
Figure 11: Performance of hedge funds over stocks since 1999
Figure 11 charts the performance of the Eurekahedge Hedge Fund Index and the MSCI World Index since December 1999. So far in 2011 hedge funds remain behind global markets as at June YTD, posting gains of 0.33% while the MSCI World Index is up 1.08%. This performance is primarily because managers remain wary of the extended rally in global markets with a view that market fundamentals do not support the valuation levels. Given recent market conditions, we maintain the view that hedge fund managers are positioned to outperform in 3Q 2011, as well as in the long term.
Also displayed in Figure 11, hedge funds have gained 221.2% since the inception of the index in December 1999, outperforming global stocks which witnessed a net loss of 5.6% over the same period of time. Active hedge fund managers throughout this period witnessed two global recessionary periods, the bursting of the 2000 tech bubble and the more recent 2008 financial crisis. In the first downturn, global stocks fell 46.8% from peak to bottom but the Eurekahedge Hedge Fund Index increased 31.1% while in the 2008 financial fallout, the MSCI World Index lost 52.6% of their index value (a maximum drawdown of 52.6%) while hedge funds lost only 11.4% in the same timeframe.
As such, hedge funds have become increasingly attractive to investors such as pension funds and family offices – groups who seek investments that are able to provide a high degree of capital preservation as well as a high risk adjusted return. Apart from posting low drawdown statistics, hedge funds also provide significantly lower volatility as compared to the stock markets. The annualised standard deviation of hedge funds over the 2000 to June 2011 period is 5.4%, almost a third of the 15.6% annualised volatility of the MSCI World Index. It should also be noted since January 2000, global equity markets have seen four years of negative returns while the Eurekahedge Hedge Fund Index was in the red for only one year.
Figure 12: Performance across alternative investment vehicles
Figure 12 provides a snapshot of how hedge funds have fared against other alternative investments such as long-only funds and funds of funds in recent years. The first of the 3 years from June 2008 to June 2009 was marked by a period of exceptional market turmoil in which the S&P 500 volatility index rose above 80 and the S&P 500 Index fell to a multi-year low of 667. The subsequent two years witnessed strong recovery as easy monetary policies and a resurgence of confidence lifted global markets. The Eurekahedge Hedge Fund Index was the top performing index over 3 years with a 5.71% annualised return while funds of funds were down 2.20% in on the annualised basis.
In 2010, long only funds achieved a 15.91% gain on average thanks to a healthy stock market rally however this year, hedge funds have outperformed the others by staying in positive territory. Given recent market conditions of high volatility we expect hedge funds to continue outperforming other comparable investment vehicles as well as the underlying markets in 2011.
Table 7: Performance across alternative investment vehicles
|
EH Hedge Fund Index
|
EH Long-Only Absolute Return Fund Index
|
EH Fund of Funds Index
|
6 month returns
|
0.33%
|
-1.01%
|
-0.75%
|
2010 returns
|
10.84%
|
15.91%
|
4.51%
|
3 year annualised returns
|
5.71%
|
3.50%
|
-2.20%
|
Source: Eurekahedge
Figure 13: Performance across strategic mandates

Figure 13 breaks down the performance of hedge funds across the different strategic mandates by 3 year annualised returns, 2010 returns and 2011 June YTD returns. All strategies posted net gains in the 3 year measure as well as in 2010, with managers successfully manipulating gains in volatile markets. Distressed debt investing funds delivered outstanding returns in all three measures, with a 2011 gain of 5%, 23.04% in 2010 and a 3 year total return of 35.71% (annualised 10.71%). Low central bank rates, falling defaults on leveraged loans and an increased amount of cash on company balance sheets lifted the valuations of distressed debt portfolios. Event driven managers also witnessed strong gains as the Eurekahedge Event Driven Hedge Fund Index posted a 3 year annualised gain of 9.24% and was up +15.47% in 2010. Managers found a variety of hard catalysts to unlock value, such as spin-offs, company split-ups, as well as increasing M&A activity. Similarly, there were a number of soft catalysts, such as dividend increases, share buybacks and balance sheet restructurings.
Table 8: Performance across strategic mandates
|
Arbitrage
|
CTA / Managed Futures
|
Distressed Debt
|
Event Driven
|
Fixed Income
|
Long / Short Equities
|
Macro
|
Multi-Strategy
|
Relative Value
|
6 month returns
|
2.67%
|
-3.02%
|
5.00%
|
0.77%
|
3.04%
|
0.57%
|
-0.56%
|
1.06%
|
2.13%
|
2010 returns
|
9.41%
|
12.15%
|
23.04%
|
15.47%
|
10.37%
|
10.25%
|
7.59%
|
9.57%
|
11.28%
|
3 year annualised
returns
|
7.45%
|
5.25%
|
10.71%
|
9.24%
|
7.32%
|
4.49%
|
6.14%
|
6.43%
|
8.21%
|
Source: Eurekahedge
Figure 14: Performance across regional mandates
The recovery of global markets as well as increased investor confidence has resulted in healthy gains in hedge funds across all regions. Major hedge fund regions reported performance of more than 2.5% in 3 year annualised returns with Latin America focused funds coming out on top. Not only did managers deliver excellent returns in 2009 and 2010, they also provided substantial downturn protection during the financial crisis, losing only 5.01% in 2008 at a time when most other hedge fund regions witnessed significant drawdowns. Furthermore, the strong performance of Latin American markets in 2009 and 2010 (a period when more emerging market economies posted outstanding returns), has also helped the managers to attract significant capital, leading to current AuM by Latin American hedge funds standing at historically high levels.
Managers investing in North America delivered the best returns in 2010, gaining an impressive 13.60% and displayed substantial alpha in 2010 by protecting capital through downturns, while capturing most of the upside in trending markets in a year marked by volatile market conditions and sudden trend reversals. Additionally, positive net flows for 11 straight months were also helpful for managers as they were not overly hampered by redemption pressures.
Over the last 6 months, Latin American managers have posted the highest returns of (with 3.06%). While most other regional hedge funds remain in positive territory, the increased volatility in the markets has affected performance. Even so, all regional mandates remain ahead of the underlying markets by significant margins and we expect hedge funds to post another year of outperformance in 2011.
Table 9: Performance across regional mandates
|
North American Hedge Funds
|
European Hedge Funds
|
Asia ex–Japan
Hedge Funds
|
Japanese Hedge Funds
|
Latin American Hedge Funds
|
6 month returns
|
2.25%
|
0.29%
|
-1.00%
|
0.95%
|
3.06%
|
2010 returns
|
13.60%
|
9.22%
|
10.20%
|
8.21%
|
9.80%
|
3 year annualised returns
|
8.41%
|
2.83%
|
7.90%
|
2.70%
|
10.17%
|
Source: Eurekahedge