Tuesday, October 19, 2010

2010 Key Trends in Islamic Funds


Introduction

The rapid development of the Islamic fund industry over the last decade represents the progress and advances made in the Islamic finance sector. The primary goal of Islamic funds is to engage in 'ethical investing' into products and companies that are acceptable to the Islamic faith. As such, Islamic funds are wealth management vehicles that cater to investors who want exposure to capital markets inside a Shariah framework, which is the key distinguishing factor from other conventional funds.[1]

Currently, the total number of Shariah-compliant investment vehicles is estimated to be 690, with assets standing just over US$72 billion. Figure 1 shows the growth in the total number of Islamic funds since 2000.

Figure 1: Industry Growth over the Years


The Islamic fund sector experienced sustained growth in 2007, which saw the launch of 180 funds. However, subsequent years have seen a decline in launch activity though it should be noted that despite a slow growth rate, the number of funds did not decrease as Islamic funds mostly invest in asset-backed securities and do not apply leverage,  hence, limiting performance-based losses. Additionally, existing funds have further consolidated their positions in 2009 and 2010 – the Eurekahedge Islamic Funds Index is up 32.17% since February 2009.

The new launches in 2009 and 2010, although comparatively small in number, represent increasing diversity in the industry in terms of asset classes and industry segments as well as geographies and investors. The sector has adjusted to the changed landscape post-financial crisis and has attracted attention from various quarters including western banks and investors. Sukuk issuances have picked up substantially, even from companies such as General Electric, while new Islamic funds have launched in places like Australia.[2]

The rest of this report gives a snapshot of the current industry make-up as well as the latest performance trends.

Industry Make-Up and Growth Trends

Malaysia and Saudi Arabia remain as the most popular Islamic fund centres as they boast the most dynamic Islamic finance industry as well as the greatest number of investors. Saudi Arabia has recently increased its share as the fund centre of choice due to the growing popularity of retail funds among consumers as well as the emergence of Islamic bond market (sukuk) in the country. Malaysia was one of the early movers in the industry, with Islamic funds launched as early as the 1970s and further cementing its place as the leading fund centre throughout the 2000s. A liberalised Islamic banking sector with Shariah framework established in the 1980s proved to be a conducive environment for growth in the industry. Malaysia further plans to issue more licenses to foreign banks in the next three years and, as such, is set to be the leading Islamic fund centre in the coming years.

Figure 2: Head Office Locations by Number of Funds


 Geographic Mandates

The majority of Islamic fund assets are invested in the Middle East and Africa region primarily because it holds the greatest number of companies that are Shariah-compliant. Furthermore, other than a handful of US- and UK-based funds, Middle East-based funds boast the highest average assets under management and managers tend to invest in the regions that they are based in. Other than the Middle East, a significant amount of capital from Islamic funds is invested with a global mandate to cater to the portfolio diversification requirements of clients.

Figure 3: Geographic Mandates by Assets under Management


 Asset Classes

Equity investments account for 40% of Islamic fund assets primarily because allocating to Shariah-compliant companies (becoming shareholders) forms the easiest method of Islamic investment. Furthermore, equities have been the best performing asset class in the last 40 years and continue to be the most popular among investors who also find it easier to understand as compared with other more complicated Islamic finance instruments. Fixed income investments account for 21% of the assets; however, only 7% of the funds employ a fixed income mandate, showing that there are very few but large Islamic funds focused on sukuk investments. Other asset classes are, however, becoming increasingly popular as the sector develops to encompass other investments.

Figure 4: Asset Classes by Assets under Management


Fund Types

Since most Islamic funds cater to the retail investor, they are structured as mutual funds and other regulated products. Regulatory oversight marks a key aspect of Islamic funds and countries such as Malaysia, which have well-established Shariah regulations, would ensure compliance through government bodies – in this case, the Securities Commission of Malaysia.

While the speculative and secretive nature of most hedge fund strategies makes it difficult to ensure Shariah compliance, there are a number of Islamic private equity funds as acquiring shares of companies can easily be brought into compliance.

Figure 5: Fund Types by Number of Funds


Performance Review

Over the years, Islamic funds have delivered greater and more consistent performance as opposed to mutual funds as well as direct investments in the markets. The Eurekahedge Islamic Funds Index has gained 21.77%[3] since its inception in December 1999 as compared with a 30.5% loss for the MSCI World Index over the same period.

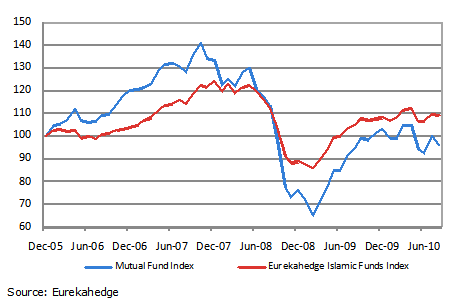
Similarly, hedge funds have delivered higher and more consistent risk-adjusted returns than mutual funds. Figure 6 displays the Eurekahedge Islamic Funds Index mapped out against the Eurekahedge Bespoke Mutual Funds Index since December 2005. Over this period, Islamic funds returned 8.99% as opposed to a 4.20% loss in mutual funds – an outperformance of more than 12%. Furthermore, in addition to better returns, Figure 6 clearly shows that Islamic funds are less volatile in nature and also provide better downturn protection as compared with mutual funds.

Figure 6: Islamic Funds vs Mutual Funds

The results posted by the Islamic funds over the last few years show that ethical investing does not necessarily have to come at the cost of lower returns. Additionally, most of these funds are structured as mutual funds and hence, the benefits are readily available to retail investors.

Table 1 and Figure 7 compare the performance of Islamic funds investing in equities with socially responsible investing and the world equity markets.

Table 1: 3-Year Performance of Islamic Funds vs Stock Market Indices


Eurekahedge Islamic Funds Equity Index
Dow Jones Sustainability Index
MSCI World
Index
12-Month Returns
3.43%
-0.30%
0.28%
YTD 2010 Returns
0.08%
-8.67%
-6.40%
3-Year Annualised Returns
-4.48%
-9.94%
-11.87%
3-Year Annualised Standard Deviation
18.24%
25.00%
20.38%


Figure 7: 3-Year Performance of Islamic Funds vs Stock Market Indices


The Eurekahedge Islamic Fund Equity Index registered a 12-month return of 3.4%, beating other broad stock market indices which were either negative or flat. With the help of good risk management systems and by sticking to a limited universe of Shariah-compliant stocks, Islamic managers also outperformed traditional long-only equity investment mandates. In particular, Islamic funds avoided companies that are deemed speculative in nature such as highly geared firms. In the widely cited 'new normal' environment where credit is hard to get, these highly leveraged firms are expected not to perform very well.

Figure 8 tracks the same three indices over the longer term.

Figure 8: Islamic Equity Funds vs Stock Market Indices over the Years


The Eurekahedge Islamic Fund Equity Index has gained 11.8% since December 1999, whereas the MSCI World Index lost 30.5% and the Dow Jones Sustainability Index was down 8.9% over the same period. Furthermore, out of these three investments, Islamic funds suffered the least drawdown during the 2008 financial crisis.

Figure 9: Performance of Islamic Funds by Investment Geographic Mandates


Figure 9 shows the performance of Islamic funds across geographic mandates. Islamic funds investing in the Asia Pacific region delivered the strongest performance over the past three years, 12 months and in 2010 (2.48%, 2.79% and 7.22%, respectively). A large proportion of Asia Pacific Islamic funds are invested in the Malaysian and Indonesian markets, which underwent remarkable growth in 2009 and 2010. The FTSE Bursa Malaysia Stock index jumped 11.8% YTD August while the Jakarta Composite Index was up 21.6%. Indonesian stocks have reached all-time highs and the re-election of President Yudhoyono has prompted expectations of another era of political stability and strong economic growth in the country.

 Table 2: Performance of Islamic Funds by Investment Geographic Mandates


Eurekahedge
Asia Pacific Islamic Fund Index
Eurekahedge
Global
Islamic Fund Index
Eurekahedge
Middle East/Africa Islamic Fund Index
12-Month Returns
7.22%
3.13%
-1.72%
YTD 2010 Returns
2.79%
-2.48%
1.15%
3-Year Annualised Returns
2.48%
-1.95%
-6.49%
3-Year Annualised Standard  Deviation
11.46%
11.42%
15.81%
% Below HWM
-1.33%
-10.60%
-29.00%


Figure 10: Performance of Islamic Funds by Instrument Traded


Islamic fund managers who were partially or fully invested in fixed income or money market instruments have registered healthy gains over the last few years. Islamic funds benefited from rallies in the Islamic bond market – the HSBC/NASDAQ Dubai US Dollar Sukuk Index, which tracks a basket of Islamic bonds, posted gains to the tune of 11.1% in the first three quarters of this year. With more capital being employed in the Middle East and Asian Islamic bond markets, managers in the sector look well set to further extend their positive run.

Table 3: Performance of Islamic Funds by Instrument Traded


Eurekahedge Islamic Fund Balanced Index
Eurekahedge Islamic Fund Equity Index
Eurekahedge Islamic Fund
Fixed Income Index
Eurekahedge
Islamic Fund
Money Market Index
12-Month Returns
5.10%
3.44%
3.71%
2.95%
YTD 2010 Returns
0.82%
0.08%
2.26%
1.46%
3-Year Annualised Returns
0.02%
-4.48%
3.32%
3.04%
3-Year Annualised
Standard Deviation
12.19%
18.24%
1.09%
3.48%
% Below HWM
-9.72%
-21.97%
0.00%
0.00%


Conclusion

The Islamic fund sector has continued to mature and develop rapidly, expanding into new asset classes as well as regions. Despite the industry suffering some setbacks during the financial crisis, Islamic funds rebounded sharply in the last 18 months and delivered excellent returns. Furthermore, the sector has outperformed not only the underlying markets but also other comparable investments such as mutual funds, showing that the quest for profit is not necessarily at odds with ethical investments.

Going forward, we expect Islamic fund managers to continue outperforming the markets while also expanding to cover new instruments and asset classes. The industry continues to gain traction among investors and we anticipate further growth through asset flows and fund launches in the next few years.

[1] For a more detailed description of what constitutes Islamic investing, please refer to the Eurekahedge Key Trends in Islamic Funds report published in January 2010. www.eurekahedge.com/news/10_jan_EH_IF_KeyTrends_Full_ABR.asp
[2] Please go to www.eurekahedge.com/news/attachments/KeyTrends/EH_IF_2010_KeyTrends.pdf to learn more about the developments in the Islamic fund industry.
[3] All figures given are as of end-August 2010.

Overview of 2010 Key Trends in Latin American Hedge Funds


Introduction

2010 has seen the Latin American hedge fund industry emerge as one of the most dynamic sectors in the global hedge fund space. While performance and growth in most other hedge fund regions remained slow or registered marginal declines, Latin American hedge funds continued to provide consistent returns to their investors. The average Latin American manager has seen only two instances of marginally negative returns in the last 23 months. Figure 1a tracks the industry assets since January 2009.

The Eurekahedge Latin American Hedge Fund Index remained the best performing broad-region hedge fund index through most of this year, with its year-to-date August return standing at 3.97%. Furthermore, the net assets under management in regional hedge funds have grown to reach US$55.4 billion as at end-August 2010. This translates into a 41% increase in net assets in 18 months.

Figure 1b shows the growth in the Latin American hedge fund industry through the last decade. While the total number of funds in the region has grown nearly four times since 2000, the assets under management have increased by more than 20 times over the same period.
Figure 1a: Growth in Assets since January 2009

Figure 1b: Industry Growth over the Years

The growth in industry assets picked up incrementally after 2003, registering a three-fold increase from 2004 to 2007. This tremendous growth is underscored by the performance of the Eurekahedge Latin American Hedge Fund Index, which has gained 476.69% since its inception in December 1999, with an average annualised return of 17.70%, the highest amongst all major hedge fund regions.

Although Latin American hedge funds were also affected by the credit crunch and the financial crisis, managers delivered admirable downturn protection through this period with average losses of only 4.79% at a time when the average global hedge fund was down 10.87%. Although total assets decreased by 25% in 2008 and 1Q2009, due to record redemptions out of hedge funds, the industry has posted a remarkable recovery since then. In 2009 alone, Latin American managers posted a massive return of 28.02% while also attracting US$9.2 billion in the last three quarters of the year. Table 1 shows the asset flows and performance-based growth in the Latin American hedge fund industry since the start of 2008.

Table 1: Monthly Asset Flow in Latin American Hedge Funds

Month
Net Growth (Perf)
Net Flows
Assets at end
2007
6.1
12.0
56.4
Jan-08
-0.5
-0.3
55.6
Feb-08
1.4
-0.5
56.5
Mar-08
-1.0
0.5
56.0
Apr-08
0.7
-0.1
56.6
May-08
1.2
-0.6
57.1
Jun-08
0.2
1.1
58.4
Jul-08
-0.8
0.6
58.2
Aug-08
-0.8
-0.8
56.6
Sep-08
-1.9
-2.1
52.7
Oct-08
-1.5
-2.9
48.3
Nov-08
0.2
-3.2
45.3
Dec-08
0.3
-3.7
41.9
2008
-2.5
-11.9
41.9
Jan-09
0.5
-2.2
40.2
Feb-09
0.1
-0.9
39.4
Mar-09
0.2
-0.3
39.3
Apr-09
0.9
0.6
40.8
May-09
1.2
1.9
43.9
Jun-09
0.1
0.6
44.7
Jul-09
0.8
1.5
47
Aug-09
0.6
1.7
49.3
Sep-09
0.9
1.3
51.5
Oct-09
0.2
0.8
52.5
Nov-09
0.7
0.5
53.8
Dec-09
0.4
0.3
54.5
2009
6.6
5.9
54.5
Jan-10
0.1
0.1
54.6
Feb-10
0.1
0.8
55.5
Mar-10
0.6
0.3
56.4
Apr-10
0.2
-0.3
56.3
May-10
-0.5
-0.6
55.2
Jun-10
0.3
-0.2
55.3
Jul-10
0.6
-0.2
55.8
Aug-10
0.3
-0.7
55.4
Note: All figures are in US$ billion, unless otherwise stated.
Source: Eurekahedge

Figure 2 illustrates the growth in Latin American hedge funds and global hedge funds due to asset flows since January 2008. Compared with global hedge funds, the rate of growth in Latin American funds has been nearly 20% greater as investors looked to diversify from traditional hedge fund regions in the wake of the financial crisis. In addition to increasing interest from global investors, local investors have also contributed significant capital to the industry.

Figure 2: Asset Flows to Latin American Hedge Funds vs Global Hedge Funds

An important factor to consider when analysing the Latin American hedge fund industry is the difference between onshore and offshore hedge funds. Onshore Latin American hedge funds are mostly set-up in Brazil, which is the largest economy in the region, and denominated in Brazilian real. The reasons for a large local hedge fund market is that there are strict controls regulating the flow of capital in and out of the country, investors have to set-up special accounts, pay additional taxes, and all transactions have to go through the central bank. As such, investors look for real-denominated hedge funds, thereby creating a market for hedge fund managers.

Both onshore and offshore Latin American hedge funds have witnessed continuous growth over the last decade. The need to differentiate between onshore and offshore hedge funds arises from the fact that a majority of the onshore hedge funds are based in Brazil and denominated in the real, which has very high interest rates, thereby generating higher returns than offshore hedge funds, which are usually denominated in US dollars or other major currencies.

While offshore hedge funds make up a larger proportion of assets under management in Latin America, the growth rate of onshore hedge funds has been greater in recent times. Before the financial crisis, high-net-worth individuals in Latin America had a strong preference for offshore fund structures due to tax incentives; however, due to the increasing focus on greater regulations, onshore hedge funds have started to generate greater demand. Not only have onshore managers recovered all of their assets that were withdrawn in 2008, the current size of the industry is US$17.2 billion, which is near the all-time high.

Onshore Hedge Fund Regulation

Despite Latin American hedge funds suffering some setbacks in 2008 primarily from negative net asset flows, positive performances in 2009 and 2010 have provided investors with renewed confidence that the Latin American hedge fund industry is built on a solid foundation. The Latin American onshore hedge fund market is largely dominated by Brazil, which not only hosts a number of service providers but also employs one of the most comprehensive regulatory framework in the world.

Hedge funds domiciled in Brazil are mandated to have daily redemption policies and are regulated by the Comissão de Valores Mobiliários (Securities and Exchange Commission of Brazil). Additionally, onshore hedge funds are required to disclose their holdings to regulators on a monthly basis while some hedge funds also provide weekly reports to independent risk managers. The regulators in Chile, Brazil and Mexico are also much stricter in terms of liquidity, risk exposure, mark-to-market and net asset value accounting than their counterparts in offshore market.

There has not been a single case of fraud in the region partly because regulations require independent (third-party) service providers and external risk assessment for domestic hedge funds. The confidence in the industry is demonstrated by the fact that in percentage terms, the net flows into onshore hedge fund vehicles have outpaced net flows into offshore hedge funds over the last eight months. Figures 3 and 4 show the comparative growth in onshore and offshore Latin American hedge funds.


Figure 3: Onshore and Offshore Industry Growth over the Years


Figure 4: Net Flows into Onshore and Offshore Latin American Hedge Funds

Head Office Location and Domiciles

While nearly 90% of onshore Latin American funds are based and domiciled in Brazil, the head office location of offshore Latin American funds shows a more global distribution. Most offshore managers are located in the United Kingdom and the United States, which collectively account for nearly 50% of funds. It should be noted that a similar breakdown in terms of assets under management shows that hedge funds located in the UK and the US manage almost 60% of the assets. This is primarily because of larger hedge fund investor base in these regions; however, there is now a greater diversity in the geographic location of Latin American hedge funds.


Figure 5: Head Office Location by Number of Offshore Funds


A key point to note here is that Brazil is home to 32% of offshore funds, which are domiciled in offshore locations and primarily denominated in US dollars. Since Brazil itself is the largest economy in Latin America and managers tend to prefer geographical proximity to their investment regions in order to better monitor their portfolios, this is not a surprising development. Furthermore, Brazil also hosts a growing population of affluent individuals providing an investor base for managers, along with an increasing pool of talent and service providers.

In terms of fund domiciles, the offshore industry continues to be dominated by Cayman Islands-domiciled funds while Brazil, unsurprisingly, is the domicile of choice for more than 90% of onshore funds.

Figure 6: Domicile by Number of Funds


Geographic Mandates

Figures 7a-7c show the changes in the geographical mandate of Latin American hedge funds over the last five years. The figures include funds based in and investing in Latin America.


Figures 7a-7c: Geographic Mandates by Assets under Management


The most prominent trend observed in the breakdown by geographical mandate is the increase in the assets of Brazil and Latin America focused funds. The two primary reasons for this are a) better performance of Latin American hedge funds over the last few years as compared with global hedge funds and b) greater allocations to region-/country-specific hedge funds.

While global and emerging markets focused funds witnessed sharp losses in 2008, Latin American funds were down only 4.59% – as such, they did not suffer performance-based declines to the same extent. This further prompted investors who had earlier been allocating to the region through broad-mandated funds to invest directly into funds focused specifically on the region. Additionally, the recovery in Latin American markets in 2009 and 2010 has outpaced the global markets turnaround, hence, not only supporting performance but also building up investor interest in the region. As of end-September 2010, the MSCI Emerging Markets Latin America Index was up 123.26% since March 2009 while the MSCI World Index gained 57.04% over the same time period. Furthermore, the increasing population of high-net-worth individuals in Latin America has also provided regional managers with a new pool of investors who are familiar with the markets and prefer to invest in the region.

Strategic Mandates

The strategic mandate distribution of Latin American hedge funds also shows differing characteristics between onshore and offshore funds, and hence, their trends are discussed separately.


Figures 8a-8b: Onshore Strategic Mandates by Assets under Management


As shown in Figures 8a-8b, while multi-strategy investing remains the most popular mandate amongst onshore managers, the percentage of assets allocated to this strategy has fallen from 63% in 2006 to 48% in 2010. Two reasons for this change are a) due to increased risk aversion, investors re-allocated substantial capital to fixed income hedge funds during the financial crisis in 2008 – a move that proved beneficial as funds posted a return of 11.27% in 2008, and b) the hefty gains posted by event driven Latin American funds which resulted in greater growth in assets as opposed to other strategies.

Among the various offshore Latin American hedge fund strategies, fixed income, event driven and distressed debt have witnessed significant increases in their share of the total assets. While fixed income managers attracted significant capital from investors, event driven and distressed debt hedge funds increased their assets primarily from extraordinary performances in 2009 and 2010. Event driven hedge funds also witnessed capital inflows, driven by the growing interest in emerging markets and availability of new corporate activity opportunities.

Figures 9a-9b: Offshore Strategic Mandates by Assets under Management


Fund Sizes

Figures 10a-10c: Fund Sizes


The composition of the Latin American hedge fund sector in terms of fund sizes has varied according to the total industry assets. Although the current breakdown of funds is similar to that in 2006, the main difference is the 10% increase in small hedge funds managing less than US$50 million. This group represents those managers who witnessed significant withdrawals in 2008-2009 as well as hedge fund launches. Given that asset raising environment has not been favourable especially for small hedge funds, new managers have struggled to raise assets in the last 12 months.

Fees

Tables 2a and 2b show the changes in the fee structure of Latin American hedge funds as well as Asian and global hedge funds. While the trend of lower fees has been true across all regions in 2009-2010, Latin American funds have not made drastic changes to their fee structure. Although in 2009, Latin American start-up funds did lower their fees in line with investor demands, the average performance fees of funds launched in 2010 are back at 20%.

Table 2a-2b: Average Fees of New Launches in Latin American, Asian and Global Hedge Funds

Management Fees (%)
Year
LAHF
AHF
GHF
2005
1.80
1.73
1.71
2006
1.73
1.62
1.65
2007
1.89
1.84
1.74
2008
1.90
1.68
1.65
2009
1.62
1.66
1.64
2010
1.88
1.58
1.55
Performance Fees (%)
Year
LAHF
AHF
GHF
2005
19.30
19.42
19.73
2006
19.27
18.78
19.02
2007
19.66
19.08
19.32
2008
20.47
18.86
18.84
2009
18.33
17.94
17.61
2010
20.00
19.22
18.95


Performance Review

After posting an excellent return of 28.02% in 2009, Latin American hedge funds have consistently been the best performers in 2010 among all broad hedge fund regions – the Eurekahedge Latin American Hedge Fund Index was up 3.97% YTD August. Figure 11 compares the performance of Latin American hedge funds with underlying markets, represented by the MSCI Emerging Markets Latin America Index.

Figure 11: Performance of Latin American Hedge Funds vs MSCI Latin American Index


Over the last 10 years, Latin American hedge funds have delivered an annualised return of 17.70%, gaining 476.69% and outperforming underlying stock markets by 211%. Furthermore, the outperformance of hedge funds was exceptionally pronounced during the downturns of the last 10 years as managers used derivatives, short instruments and other hedging techniques to navigate through volatile financial markets. The Eurekahedge Latin American Hedge Fund Index posted gains of 14.9%, 17.3% and 20.1% in 2000, 2001 and 2002, respectively, while the MSCI Latin American Index sank by 18.4%, 4.3% and 24.8%, respectively, in those years. Additionally, the predominance of multi-strategy mandated funds means that managers also took positions in Latin American bonds and commodities outside of equities. This low correlation approach also helped Latin American funds surpass stock markets in the long run.

Within the Latin American hedge fund sector, onshore funds have delivered better performance than their offshore counterparts primarily due to the high interest rate of the Brazilian real. The Eurekahedge Onshore Latin American Hedge Fund Index has gained a massive 679% since its inception in December 1999 while the Eurekahedge Offshore Latin American Hedge Fund Index climbed 332% in the same period. Onshore funds have also delivered better returns in the shorter term, when compared with offshore Latin American hedge funds as shown in Table 3.

Table 3: Performance of Onshore and Offshore Latin American Hedge Funds


EH Latin American Hedge Fund Index
EH Latin American Offshore
Hedge Fund Index
EH Latin American Onshore Hedge Fund Index
12-Month Returns
11.40%
9.54%
12.20%
YTD 2010 Returns
3.97%
1.41%
5.07%
3- Year Annualised Returns
9.50%
4.25%
11.76%
3-Year Annualised Standard Deviation
6.60%
9.71%
5.45%

Performance by Fund Size

Figure 12: Performance of Latin American Hedge Funds across Fund Sizes

The breakdown of Latin American hedge fund performance by fund size also shows some interesting trends. While funds across all size categories have delivered healthy returns in 2010, the larger funds have outperformed their smaller counterparts, gaining 4.58% on average. This trend also extends to the 12-month and the 3-year annualised returns figures, where large Latin American hedge funds have delivered higher returns than medium and small Latin American funds. Additionally, this outperformance has led to further inflows from investors; currently, the top 50 hedge funds in Latin America account for more than 70% of the industry assets.

Some of the reasons for these trends are given below:
  • Managers with a greater asset base are in a stronger position to get better deals from prime brokers (ie, negotiate for lower transaction costs), hence, helping future performance.
  • Redemption from a few investors will not force managers to liquidate potentially winning positions.
  • Financial magazines and media tend to report more on large hedge funds, providing greater exposure and free marketing.
  • Larger marketing budgets, hence, the ability to attract more capital.

Table 4: Performance of Latin American Hedge Funds across Fund Sizes


EH Small
Latin American
Hedge Fund Index
(<US$25 million)
EH Medium
Latin American Hedge Fund Index
(US$25-US$75 million)
EH Large
Latin American
Hedge Fund Index
(>US$75 million)
1-Month Returns
9.42%
11.98%
11.98%
YTD 2010 Returns
3.35%
3.91%
4.58%
3-Year Annualised Returns
7.98%
8.46%
12.46%
3-Year Annualised Standard Deviation
5.08%
7.31%
6.67%


Strategy Performance

Figure 13: Performance of Latin American Hedge Funds across Strategic Mandates


Latin American hedge funds across all strategic mandates look set to finish the year in positive territory, with all hedge fund strategy indices currently in the green. 2010 has seen the spotlight turn to fixed income hedge funds as they have racked up gains of 6.4% YTD August. Managers investing in high yielding emerging market debt, such as issues in Brazil, added substantial gains to their portfolios while arbitrage managers have also brought in profits of 5.63% through exploiting the various opportunities present in volatile market conditions.

In the 3-year measure, event driven hedge funds lead the way with an annualised return of 16.03% amid increased corporate activity in 2009 and 2010. Event driven managers have capitalised on a busy M&A environment over the last two years as the Latin American market saw US$164 billion worth of deals come onto the table in the first nine months of 2010. The value of the deals announced during the same three quarters last year was US$74 billion.

Table 5: Performance of Latin American Hedge Funds across Strategic Mandates


EH Latin American Arbitrage
Hedge Fund Index
EH Latin American Event Driven Hedge Fund Index
EH Latin American Fixed Income Hedge Fund Index
EH Latin American Long / Short Equities Hedge Fund Index
EH Latin American Macro
Hedge Fund Index
EH Latin American Multi-Strategy Hedge Fund Index
12-Month Returns
8.32%
12.76%
11.15%
13.16%
6.24%
10.36%
YTD 2010 Returns
5.63%
0.50%
6.36%
3.55%
1.09%
4.03%
3-Year Annualised Returns
11.30%
16.03%
11.02%
8.85%
8.16%
9.04%
3-Year Annualised Standard Deviation
1.08%
12.08%
1.90%
10.38%
4.39%
5.71%

Conclusion

The Latin American hedge fund industry witnessed remarkable growth in the first seven years of the last decade before experiencing some rough times during the financial crisis. However, even during the downturn, regional managers still outperformed the underlying markets as well as hedge funds in other regions. Since then, the industry has posted an excellent recovery, with the average Latin American hedge fund up nearly 40% since November 2008.

The region's managers have also attracted significant assets over the last 18 months, bringing the current size of the Latin American hedge fund industry back to historical highs – US$56 billion. With an increasing base of local investors, strong economic fundamental and highly expected growth rate, the sector will continue to attract an increasing amount of capital going forward. Furthermore, with the emphasis on regulations post-financial crisis, the well-developed regulatory framework of the region's hedge fund industry will also be beneficial in attracting capital.

In terms of performance, Latin American managers have outperformed the underlying markets by more than 5% in annualised returns and going forward, we expect managers to deliver similar results. We also anticipate Latin American hedge funds to outperform other regions due to the excellent growth prospects in the underlying economies.