Introduction
The global fund of hedge funds industry witnessed some very strong trends over the last decade, in terms of size and population as well as different aspects of the industry’s make-up. After growing at an incremental pace in the 2003 to mid-2008 period, the size of the industry reached US$826.2 billion in March 2008. However excessive losses and widespread redemptions, triggered by the global financial crisis and some high profile frauds, reduced total assets under management substantially and by July 2009 industry assets fell to US$433.7 billion.
Figure 1 shows the industry growth in assets under management and fund population since 2000.
Figures 1 - 2: Industry growth between 2000 and 2011
Source: Eurekahedge
Since 2010, the industry assets have posted a slight growth, however most of that has been through performance rather than net positive asset flows. The Eurekahedge Fund of Funds Index was up 9.57% and 4.48% in 2009 and 2010 respectively and remains in positive territory in 2011.
The assets under management have steadily crept up to reach US$467 billion as at end-March 2011, despite a round of profit taking by investors in November and December 2010.
|
Source: Eurekahedge
|
Asset flows
Table 1 shows the monthly changes in industry assets since January 2008, broken down by performance based gains/losses and net asset flows. Although the trend of heavy outflows witnessed in 2008-2009 ended in July 2009, the first half of 2010 also saw sustained redemptions primarily due to the European debt crisis and fears of a double-dip. However these outflows were not of the same extent as those seen previously, and were mostly countered by positive performance. In fact the net flows in 1Q 2011 were positive, making it the first quarter of positive net flows since 1Q 2008, and signalling that the consistent returns posted by funds of hedge funds might have turned investor sentiment around and we expect to see the positive trend continue through 2011.
Table 1: Monthly asset flows in fund of funds
Month
|
Net Growth (Performance)
|
Net Flows
|
Assets at end
|
Jan-08
|
-13.6
|
22.7
|
817.8
|
Feb-08
|
6.7
|
-9.9
|
814.7
|
Mar-08
|
-12.2
|
23.7
|
826.2
|
Apr-08
|
4.0
|
-9.3
|
820.8
|
May-08
|
8.7
|
-6.4
|
823.2
|
Jun-08
|
-5.5
|
1.9
|
819.6
|
Jul-08
|
-12.3
|
-4.3
|
803.0
|
Aug-08
|
-7.1
|
-6.3
|
789.5
|
Sep-08
|
-34.2
|
-44.7
|
710.7
|
Oct-08
|
-28.5
|
-29.1
|
653.1
|
Nov-08
|
-9.6
|
-14.0
|
629.5
|
Dec-08
|
-9.9
|
-40.6
|
578.9
|
2008
|
-113.5
|
-116.3
|
578.9
|
Jan-09
|
2.9
|
-72.2
|
509.7
|
Feb-09
|
-0.7
|
-32.2
|
476.8
|
Mar-09
|
-0.5
|
-8.7
|
467.6
|
Apr-09
|
0.7
|
-14.6
|
453.7
|
May-09
|
10.0
|
-16.3
|
447.3
|
Jun-09
|
1.3
|
-6.2
|
442.5
|
Jul-09
|
4.5
|
-13.4
|
433.7
|
Aug-09
|
4.2
|
1.6
|
439.4
|
Sep-09
|
3.4
|
0.8
|
443.6
|
Oct-09
|
3.4
|
0.8
|
447.8
|
Nov-09
|
-0.2
|
-1.5
|
446.1
|
Dec-09
|
1.2
|
0.5
|
447.9
|
2009
|
30.2
|
-161.3
|
447.9
|
Jan-10
|
1.1
|
-1.9
|
447.0
|
Feb-10
|
-0.1
|
-5.7
|
441.3
|
Mar-10
|
0.3
|
-0.5
|
441.1
|
Apr-10
|
2.4
|
-0.9
|
442.6
|
May-10
|
1.3
|
-2.2
|
441.7
|
Jun-10
|
2.3
|
-0.9
|
443.1
|
Jul-10
|
1.9
|
-0.1
|
444.9
|
Aug-10
|
1.1
|
1.1
|
447.0
|
Sep-10
|
6.5
|
6.3
|
459.8
|
Oct-10
|
5.0
|
0.0
|
464.8
|
Nov-10
|
-0.8
|
-4.0
|
460.1
|
Dec-10
|
7.0
|
-8.1
|
459.1
|
2010
|
28.1
|
-16.9
|
459.1
|
Month
|
Net Growth (Performance)
|
Net Flows
|
Assets at end
|
Jan-11
|
0.7
|
-0.8
|
459.0
|
Feb-11
|
3.3
|
4.9
|
467.2
|
Mar-11
|
-0.5
|
0.5
|
467.2
|
Source: Eurekahedge
Figure 3: Comparative growth of assets under management in funds of hedge funds and hedge fund since January 2008
Source: Eurekahedge
Figure 3 shows the comparative growth of assets under management by hedge funds and funds of funds since January 2008. While the assets in both industries are still below their respective levels at the start of 2008, the growth trends are remarkably different and hedge funds have posted a much better recovery. Hedge fund assets under management are now only 5.61% below their January 2008 level, while funds of hedge funds assets are still down by 42.88%.
This is attributed to the excellent returns posted by hedge funds over the last two and a half years as well as the strong asset flows to single manager funds. In 2010 hedge funds attracted US$66.2 billion in net flows, while also posting US$127.7 billion through performance based growth – the Eurekahedge Hedge Fund Index was up 10.87% for the year. Comparatively funds of funds saw net outflows of US$16.9 billion and posted US$28.1 billion growth through positive performance.
Industry assets have become more or less stable in 2010 and since July 2009 the assets in funds of hedge funds have increased 7.73%. Given the positive start in 2011, both in terms of asset flows and performance, we expect the multi-managers to post stronger growth this year – however they still remain far from reaching their historical highs.
Launches and closures
Figure 4 shows the quarterly launches and closures in funds of funds since end 2008, showing a decreasing fund population. While the number of funds grew exponentially between 2003 and 2007 to reach a maximum of 3,574, the attrition rate increased in 2008 and has continued to exceed the launch rate until the first quarter of 2011. Currently, the global fund of funds population stands at 3,212 and although the wholesale closure of multi-manager shops is over, the fund population is still decreasing. However, we expect the launch-closure ratio to even out through the next few quarters as the multi-managers have started to address various investor concerns, as shown in the next section.
Figure 4: Launches and closures of fund of funds over the years
Source: Eurekahedge
Fees
Table 2: Average fund of fund fees by launch year
Year
|
Average performance fee (%) of launches
|
Average management fee (%) of launches
|
2005
|
10.16
|
1.39
|
2006
|
10.03
|
1.32
|
2007
|
9.38
|
1.30
|
2008
|
8.92
|
1.40
|
2009
|
7.00
|
1.37
|
2010
|
9.20
|
1.24
|
Mar-11
|
8.21
|
1.25
|
Source: Eurekahedge
Table 2 lists the average performance and management fees for funds of funds launched over the last few years. Unlike the 2-20 fee structure most hedge funds utilise, funds of funds have lower management and performance fees. Management fees have hovered near the alternative and mutual fund industry’s average of 1-2% per year while performance fees have dropped into the single digits over recent years primarily in response to the changed situation since 2008. The additional layer of fees charged by funds of hedge funds has been questioned by investors during and after the financial crisis, especially when considering their underperformance to hedge funds, and as a response, managers moved to adjust the performance fees. The average performance fee of new funds of funds fell below 9% in 2008, and dropped to 7% in 2009, suggesting that multi-managers have been willing to further lower their cut to become more competitive, attract more capital and pass greater profits to their investors. While the average performance fee of launches was back above 9% in 2010, the new launches in 2011 have an average performance fee of 8.21% - which is still below the 10% average that was associated with funds of funds previously.
Redemption notice
Table 3 shows the average redemption notice period of funds of funds launched over the last ten years. The average redemption notice period increased steadily until 2007, and averaged around two months, however this number dropped to 1 month in 2010.
Table 3: Average redemption notice period by launch year
Launch Year
|
Average Redemption Notice (Days)
|
2000
|
47.9
|
2001
|
50.3
|
2002
|
50.2
|
2003
|
52.0
|
2004
|
59.0
|
2005
|
55.1
|
2006
|
54.7
|
2007
|
63.8
|
2008
|
58.6
|
2009
|
50.1
|
2010
|
30.1
|
2011
|
41.2
|
Source: Eurekahedge
This change also reflects the efforts by funds of funds to address the concerns raised by investors. With an increasing number of investors choosing to allocate directly to hedge funds, multi-managers realised the need for better terms and conditions for funds of funds to remain attractive. One of the major concerns among the investors has been the redemption frequency of funds of funds – in 2008, a number of managers had put up gates and suspended redemptions, which left investors unable to pull their capital from falling markets. To allow investors greater access to their cash, multi-managers have moved to allow greater liquidity. Additionally, the greater liquidity (on average) of launches in 2010 and 2011 is also due to the adoption of UCITS III framework by many multi-managers, which is discussed in the next section.
Popularity of UCITS structures
In addition of fees and liquidity, investors have also demanded greater transparency and regulation of funds of funds (and hedge funds) – which has resulted in many funds of funds adopting the UCITS III regulations, as shown in figure 5.
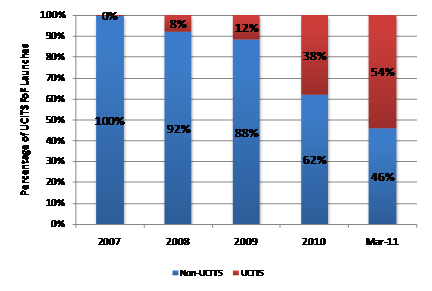
Figure 5: Percentage of UCITS funds in new launches
Source: Eurekahedge
Figure 5 shows the increasing trend amongst funds of funds to adopt the UCITS III structure. There is growing demand among institutional investors for more transparency, regulation and better liquidity and a UCITS III fund of funds meets all these requirements. The predilection for UCITSIII has been observed not only in new multi-managers setting up their funds of funds, but also amongst existing fund of funds firms that have either launched UCITS III complaint vehicles or in some cases made wholesale changes to their funds to bring them into the framework.
Funds of funds investing in hedge funds with flexible redemption terms have found it easy to launch a UCITS III version fund whereas those focusing on illiquid strategies such as distressed debt have faced significant challenges in following suit. In addition to addressing the concerns of their existing investors, multi-managers are also keen to launch UCITS III vehicles since it allows them to target new capital, such as European pension funds. The increasing share of UCITS III compliant vehicle in funds of funds launches is evidenced by the fact that more than half of the launches so far in 2011 follow the framework – and this trend is set to dominate the landscape in 2011.
Head office location
Figures 6a and 6b show the distribution of funds of hedge funds by head office location in 2006 and 2011. The breakdown of fund population has witnessed some significant changes of the last five years. The US continues to be home to the most number of managers, given that the region has the most number of fund of funds investors as well as the most number of hedge funds to invest in. However, its share of the population has decreased over the years from 34.9% to 26%, while the share of European funds has increased with the UK and Switzerland now accounting for 36.8% of the industry.
One surprising aspect is the lack of a strong presence in Asia and Latin America, even though these regions have witnessed strong growth in their respective hedge funds populations. This could be because of the relatively smaller size of hedge funds in these regions, which might not meet the investment requirements of the multi-managers. It may also point to a lack of familiarity of investing in the hedge funds operating in these regions. Additionally most fund of funds investors are located in the US and Europe and the multi-manager concept is not that popular amongst Asian and Latin American investors.
Figures 6a-6b: Head office location by number of funds
Source: Eurekahedge Source: Eurekahedge
Launches by head office location
Figure 7 shows the breakdown of funds of funds launches by head office location over the last few years. The observations from this graph complement those from Figures 6a-6b. The increasing number of launches in European centres such as the UK and Switzerland as opposed to the United States show that these places have witnessed stronger growth. In fact, post 2007, the UK and Switzerland have each witnessed greater number of launches, versus the US. This trend is partially explained by the strong growth in UCITS III compliant funds of funds, which is European regulatory framework.
Figure 7: Office locations of launches by number of funds over the years
Source: Eurekahedge
Performance by head office location
Figure 8 shows the performance of funds of funds by major head office locations. While US based multi-managers have recovered well from the financial crisis, funds of funds in Europe and Hong Kong have not delivered similar returns. We believe that this was largely due to continued redemptions in 2009 and fears of the European debt contagion in 2010.
Figure 8: Fund of funds performance by head office locations post-Madoff
Source: Eurekahedge
Geographic mandates
The fund of funds industry has also witnessed some significant trends in terms of geographic investment mandates. The sector is still dominated by North America investing funds which hold 48% of the total assets under management. This is number is actually surprising since North American hedge funds make up 66% of the total hedge funds universe. This seems to suggest that a number of North American investors looking to allocate to hedge funds in other regions prefer to go via the fund of funds route.
Figures 9a and 9b show the changes in the breakdown by exposure to regional hedge funds over the last five years. The notable changes are an 12% increase in assets invested into global hedge funds and a 7% decrease in capital allocated to North American funds. In addition to the general trend towards diversification, global-mandated hedge funds also protected capital allocated to them in 2008, losing a modest 2.7% in the year where most single-region mandates turned in double-digit losses. This outperformance led to further allocations to global funds in 2009 and 2010 as they were perceived as safer vehicles in times of high volatility.
The 6% decrease in the share of Asia Pacific mandated hedge funds is surprising given the strong results posted by the underlying hedge funds over the last two years – however this might be due to revised guidelines on fund size, volatility as well as the focus on UCITS III vehicles. Going forward we expect this share to increase through growth in the number of Asia-focused UCITS III products.
Figures 9a-9b: Geographic mandates by assets under management
Strategic mandates
Figures 10a-10b show the change in strategic mandates in the recent 5 years, highlighting some surprising results. Macro funds lost 10% of their market share in 5 years, despite being the best performing strategy. The loss in capital is mostly attributed due to investor redemptions and reallocation to other newer strategies. Multi-strategy funds however gained more market share due to the strong growth of a few large multi-managers. Event driven hedge funds have lost nearly 10% of the share, which is not surprising since the strategy tends to be rather illiquid and hence, not very compatible with the trend towards greater liquidity in the fund of funds industry.
Figures 10a-10b: Strategic mandates by assets under management
Auditors
Table 4 breaks down the market share of funds of funds auditors industry and as expected the ‘Big Four’ accounting firms took up the top 4 positions, with PWC servicing 25.2% of the funds of funds.
Smaller auditors, those listed in the others category, took up 9.6% of the industry and this share is expected to decrease further as multi-managers would rather be associated with well-known auditing firms due to the increased focus on investor due diligence. It should be noted that 2008 data showed that about 3% of the funds either had no auditor or internal auditors while in 2011, there are no such funds listed on the Eurekahedge database.
Table 4: Market share of auditors by number of funds
Auditor
|
Market Share
|
PricewaterhouseCoopers
|
25.2%
|
KPMG
|
24.2%
|
Ernst & Young
|
18.7%
|
Deloitte
|
13.5%
|
Rothstein Kass
|
3.0%
|
Grant Thornton
|
1.8%
|
Anchin Block & Anchin
|
1.4%
|
McGladrey & Pullen LLP
|
1.4%
|
BDO
|
1.2%
|
Others
|
9.6%
|
Source: Eurekahedge
Administrators
Table 5 shows the of market share of funds of funds administrators which is much more diverse than that of auditors. However with investors placing greater focus on due diligence, the multi-managers feel considerable pressure to employ well-known third-party administrators. The proportion of funds with internal administrators has nearly halved since June 2008, at which point, it was more than 8%. At the same time the administrators have to cater to increased service demand from funds of funds – and would lose their share of the market if they cannot offer a greater, more holistic service package. This implies that the larger administrators would gain more market share in future as the funds of funds industry becomes more consolidated.
Table 5: Market share of administrators by number of funds
Administrator
|
Market Share
|
CITCO
|
19.7%
|
HSBC
|
10.6%
|
SEI Investment Services
|
9.7%
|
Prime Fund Solutions
|
7.2%
|
Butterfield Fulcrum
|
5.1%
|
State Street
|
4.7%
|
GlobeOp
|
4.0%
|
Citibank
|
2.8%
|
CACEIS
|
2.4%
|
Others
|
33.7%
|
Source: Eurekahedge
Performance Review
In this sector we look at the performance of funds of funds in the short, medium and long terms and compare it to different investment vehicles. We also look at how funds of funds with different investment and strategic mandates have performed through comparison of different metrics.
Figure 11 shows the performance of funds of funds, hedge funds and the MSCI AC World Index since December 1999. In this time period funds of funds have gained 74.38% and while these returns do not match the gains delivered by hedge funds, they imply significant outperformance to the markets – which are up 0.59%. Additionally funds of funds have delivered greater risk protection over this time period – the annualised volatility of funds of funds since 1999 was 5.00%, which was lower than the 5.43% figure of hedge funds and much lower than 17.11% for the MSCI AC World Index. In 2008, the industry suffered its largest yearly drawdown, with the average fund of funds losing 19.27% due to a combination of falling global markets, excessive redemptions, leading to forced liquidations, and exposure to fraudulent funds. However, despite all these challenges, multi-managers still outperformed global markets with comparatively smaller losses seen in the average portfolio. The maximum drawdown for funds of funds since 1999 was 20.06%, which was less than half of the 56.23% drawdown for the MSCI AC World Index.
Figures 11: Performance of funds of funds, underlying markets and hedge funds
Source: Eurekahedge
Figure 12 shows the performance of funds of funds, hedge funds, long-only absolute return funds and the MSCI AC World Index over 12 months, 5 years and 10 years. While funds of funds have underperformed hedge funds and long-only absolute return funds, they have outperformed the markets in the medium and long terms. Additionally funds of funds have witnessed the lowest volatility of returns amongst all the investment classes. This suggests that fund of funds investments should appeal to long term investors as they have offered better returns with lower risk. Furthermore these returns show that a portfolio of hedge funds and/or absolute return funds will outperform will add value to investors through better risk adjusted returns in the short, medium and long terms.
Figure 12: Performance of funds of funds vs. other investment vehicles
Source: Eurekahedge
Table 6: Performance of funds of funds vs. other investment vehicles
|
EH Fund of Funds Index
|
EH Hedge Fund Index
|
EH Long-Only Absolute Return Fund Index
|
MSCI AC World Index USD
|
12 month returns
|
3.69%
|
9.78%
|
8.86%
|
11.79%
|
5 year annualised returns
|
1.51%
|
8.02%
|
4.80%
|
0.83%
|
10 year annualised returns
|
4.49%
|
10.30%
|
10.68%
|
3.10%
|
5 year annualised
standard deviation
|
6.19%
|
6.30%
|
16.86%
|
19.93%
|
10 year annualized
standard deviation
|
4.97%
|
5.27%
|
14.20%
|
17.16%
|
Source: Eurekahedge
Figure 13: Distribution of monthly fund of funds returns
Figures 13 and 14 exhibit the distribution of monthly returns of hedge funds and funds of funds since 2000, while Table 7 details their average returns, skewness and kurtosis. Given the diversified nature of fund of funds investments, their returns distribution should theoretically be closer to normal, with less skewness and kurtosis than hedge funds; however, we find that the opposite is true – as such, funds of funds pose a greater risk of fat-tail events than single-manager hedge funds.
Figure 14: Distribution of monthly hedge fund returns
Source: Eurekahedge
Table 7: Returns distribution of funds of funds and hedge funds
|
Median
|
Mean
|
Skewness
|
Kurtosis
|
Funds of funds
|
0.60%
|
0.42%
|
-1.26
|
4.57
|
Hedge funds
|
1.00%
|
0.89%
|
-0.40
|
1.60
|
Source: Eurekahedge
Performance across geographic mandates
Figure 15 shows the performance of funds of funds across the different geographic investment mandates. All geographical investments mandates have delivered positive returns in the short and long terms. In the short term, North American funds of funds outperformed their regional peers through strong returns from their underlying hedge funds. The Eurekahedge North American Hedge Fund Index was up 13.58% in the same period, which was the strongest performing major hedge fund region in the last 12 months. North America is home to the world’s most experienced and largest hedge funds and hence the region provides a large variety of choices for funds of funds managers to allocate to.
In the medium and long terms emerging market funds of funds have delivered the best returns. The robust growth in emerging markets over the years has delivered excellent profits to hedge funds and hence, subsequently to funds of funds. The Eurekahedge Emerging Markets Funds of Funds Index locked in 5 year and 10 year annualised gains of 5.64% and 12.30% respectively.
Figure 15: Performance of geographic mandates
Source: Eurekahedge
Table 7: Performance of geographic mandates
|
Asia Pacific FoFs
|
Emerging Markets FoFs
|
Europe FoFs
|
Global FoFs
|
Japan FoFs
|
North America FoFs
|
12 month returns
|
3.69%
|
4.80%
|
2.68%
|
3.23%
|
0.95%
|
6.73%
|
5 year annualised returns
|
1.69%
|
5.64%
|
-0.34%
|
1.05%
|
-1.84%
|
3.24%
|
10 year annualised returns
|
5.80%
|
12.30%
|
3.60%
|
4.00%
|
3.50%
|
5.20%
|
5 year annualised
standard deviation
|
7.90%
|
9.44%
|
6.69%
|
5.95%
|
5.98%
|
6.45%
|
10 year annualised
standard deviation
|
6.86%
|
8.17%
|
5.79%
|
4.79%
|
6.00%
|
5.06%
|
Source: Eurekahedge
Figure 16a-f: Performance of fund of funds vs. underlying mandates
Source: Eurekahedge Source: Eurekahedge
Source: Eurekahedge Source: Eurekahedge
Source: Eurekahedge Source: Eurekahedge
Performance across strategies
Figure 19 shows the performance of funds of funds across the different strategic mandates. With the exception of relative value funds of funds, all strategic mandates have delivered positive returns in the short, medium and long terms. Multi managers investing in distressed debt hedge funds achieved the best returns in the 12 months ended March 2011 as underlying single managers delivered strong gains from high yielding securities. The Eurekahedge Distressed Debt Hedge Fund Index, was up 20.52% in the same period.
Macro funds of funds turned out to be the winners in the medium and long terms, with annualised returns of 4.88% and 6.44% over the last 5 years and 10 years respectively. The top performing hedge fund strategies over the same time periods were CTA and distressed debt, and this suggests that the multi-managers invested in some of the best macro hedge funds in the world. In addition to the consistent returns, the volatility of macro investing funds of funds is also amongst the lowest.
Figure 17: Performance across strategic mandates
Source: Eurekahedge
Table 9: Performance across strategic mandates
|
Arbitrage
|
CTA
|
Distressed Debt
|
Event Driven
|
Fixed Income
|
Long / Short Equities
|
Macro
|
Multi-Strategy
|
Relative Value
|
12 month returns
|
3.04%
|
5.05%
|
6.10%
|
3.99%
|
5.04%
|
3.54%
|
4.90%
|
3.59%
|
-8.44%
|
5 year annualised returns
|
0.26%
|
4.63%
|
2.17%
|
1.28%
|
1.33%
|
0.58%
|
4.88%
|
1.49%
|
-1.71%
|
10 year annualised returns
|
2.90%
|
5.94%
|
5.60%
|
4.43%
|
4.03%
|
4.02%
|
6.44%
|
4.46%
|
1.90%
|
5 year annualised standard deviation
|
4.76%
|
6.63%
|
6.47%
|
6.16%
|
4.63%
|
8.03%
|
5.32%
|
6.11%
|
6.91%
|
10 year annualised standard deviation
|
3.66%
|
7.90%
|
4.93%
|
4.94%
|
3.80%
|
6.45%
|
4.76%
|
4.89%
|
5.42%
|
Source: Eurekahedge
Conclusion
After going through challenging times during the 2008-2010 period, which was marked by significant redemption pressure, the global funds of hedge funds industry has started to make a recovery. Although performance in 2009 and 2010 was healthy, funds of hedge funds could not match the returns posted by hedge funds and other investments. Even so, multi-managers have started 2011 in a positive manner and have also witnessed net positive asset flows. Over the last few years funds of hedge funds have also started to address the concerns raised by investors in terms of fee structures, transparency, regulations, risk management and fund administration in order to deliver a greater value proposition for their investors. Going forward, we anticipate allocations to pick up through 2011 as investors start to reallocate to fund of hedge funds and expect size of the industry to cross the US$500 billion mark by December.