Friday, July 30, 2010

2010 Key Trends in Socially Responsible Investment Funds

Introduction

This report presents the findings of a study conducted by Eurekahedge analysts on more than 1,000 SRI funds. The aim of this research report is to find the aspects of the industry in 2010, such as where the funds are investing, which sectors and asset classes and what are the different criteria being employed.

Socially responsible investment schemes, SRIs for short, are funds that seek to incorporate a variety of moral and ethical principles into their investment decisions. As such, in addition to traditional quantitative assessment of risk/return profiles, asset managers also employ increasingly sophisticated environmental, social and governance (ESG) criteria to screen for potential investments. Also known as ethical or socially conscious investing, the concept is not new and has been around since the 19th century; however, recent world events and increasing reach of information and spread of ideas have garnered greater attention for this sector.

While the origins of social investing lie in negative screening based on religious concepts, the categories within SRI’s have expanded rapidly over the last 50 years to encompass various ideological and political sentiments. Currently, the most widespread criteria employed by SRI funds include environmental record, human rights and corporate governance. For a more detailed discussion on the history, evolution and concepts of socially responsible investments in different parts of the world, please refer to the various articles[1] on the Eurekahedge website.

Changes in the Number of Funds and Assets under Management

Figure 1 shows percentage changes in the number of funds and industry assets over the last three years.

Figure 1: Percentage Growth in SRI Funds

Through the 2008-2009 period, SRI funds suffered significant losses due to the movements in the markets. The decrease in assets was proportional to the decline in global equity markets, which make up the bulk of SRI investments. Furthermore, by the end of 2009, the number of funds operating also shrunk by 6%, although overall industry assets increased during the year. The first six months of 2010 have seen some losses in assets under management; however, the rate of closures has fallen and going forward, we expect the trend of attrition to reverse by the end of the year.

Performance Review

Figures 2a-2b: Eurekahedge SRI Fund Index vs MSCI World Index and Dow Jones World Sustainability Index


While the performance of SRI funds tends to closely follow that of global equity indices, we have seen SRI funds outperform the markets over the last 12 months and also in the long term, albeit marginally. Furthermore, the 2008 returns and the June YTD returns of SRI funds show significant downturn protection offered by the funds when compared with equity markets. At the same time, SRI funds were not able to capture the heavy upsides in the years preceding the financial crisis. These performance trends are in accordance with the stricter risk management practices of SRI funds.

Table 1: Eurekahedge SRI Fund Index vs Various Indices
Long Only Absolute Return Funds
SRI Funds
MSCI World Index
Islamic Funds
DJ World Sustainability Index
2009 Returns
46.93%
22.89%
22.82%
21.52%
36.06%
Jun 2010 YTD Returns
-0.77%
-3.41%
-8.14%
-1.16%
-12.93%
3-Year
Annualised Returns Jun-07 – Jun-10
-4.78%
-7.11%
-13.41%
-2.19%
-11.92%
3-Year
Annualised Volatility Jun-07 – Jun-10
20.64%
14.92%
20.00%
12.66%
24.25%


Figure 3: SRI Funds Performance by Asset Class


Asset Class
Figure 4: SRI Funds by Asset Class and Industry Focus


While most SRI funds invest in equities, an increasing number of managers have started using other products. On the other hand, the industry-wise breakdown of the SRI space is well-diversified in terms of sectors. The next table gives the lists of the different industries and the criteria employed in positive and negative screening by the funds.

Definition
Positive/Negative Screen
Aerospace/Defence/Weapons
Avoid investing in companies involved in the production/marketing of weapons.
Negative
Animal Testing/
Animal- related
Investor sentiment in favour of humane treatment of animals. As such, firms practicing product testing on animals, as well as those that manufacturing hunting equipment, are avoided. Investments in companies that support welfare of animals are encouraged by positive screening funds.
Positive and/or Negative Screen
Tobacco/Alcohol-related
Investments in tobacco and alcoholic beverage businesses are avoided.
Negative
Gambling-related
Investments in casinos and gambling equipment suppliers are avoided.
Negative
Pornography/Child Labour
Investments in the porn industry are avoided. Firms that employ child labour anywhere in the supply chain are also avoided.
Negative
Environment
Seek and support firms with proactive involvement in ecologically friendly business activities. Shun firms with reckless environmental track record and large carbon foot print.
Positive and/or Negative Screen
Human Rights
Seek and support firms with a good human rights track record while avoiding those with poor records.
Positive and/or Negative Screen
Employee Benefits/Labour
Funds invest in those firms that meet high standards of positive labour policies while those firms with a track record of exploitation are avoided.
Positive and/or Negative Screen
Customer/Product Advocacy
Seek firms acting in the best interest of the consumers and using ethical advertising in their product marketing. Avoid firms making spurious claims and products.
Positive and/or Negative Screen
Nuclear Power
Seek firms using nuclear power to reduce our dependence upon oil/coal powered energy. Shun firms involved in the production and operation of nuclear reactors used solely for the intent of producing weapons of mass destruction.
Positive and/or Negative Screen
Alternative Energy /
Biotechnology
Seek and support firms with a proactive approach to harnessing environmentally friendly and renewable sources of energy.
Positive
Corporate Governance
Invest in firms that maintain high standards of responsibility and transparency in CSR issues. Avoid firms with a record of scandals and fraudulent activities.
Positive and/or Negative Screen
Company Investments / Foreign Operations
Seek companies committed to research and development, both home and abroad with considerable positive social benefits. Shun firms investing in technology or infrastructure that harms the environment or has considerable negative social costs associated with it. Firms with operations in countries with oppressive regimes are also avoided.
Positive and/or Negative Screen
Community/Social Issues
Invest in firms that are involved in community building projects by sponsoring employee volunteering projects and other such programs.
Positive
Positive and Negative Screening

Socially responsible funds employ positive and negative screens as the primary method to identify the companies that they wish to invest in or wish to avoid investing in. Figure 5 gives the breakdown of screens used by SRI funds.

Figure 5: SRI Funds Screens Employed


Positive Screens

As implied by the name, positive screening funds utilise research methodologies to identify the companies that they are interested in investing. For example, a fund which has environmentally conscious investors will look for companies that have a good environmental track record and will also be interested in allocating to green technology and clean energy firms. Most of the funds that employ positive screens have more than one criterion. Figure 6 shows the breakdown of screening criteria used by SRI funds (eg nearly 80% of all positive screening funds look at the environmental record of firms before deciding to invest).

Figure 6: Criteria Distribution of Positive Screens Employed


Negative Screens

Negative screening funds avoid investing in those firms that are involved in activities deemed to have a negative social impact. For example, firms that are involved in the manufacturing and marketing of weapons are avoided since their products are utilised in times of war.

Figure 7: Criteria Distribution of Negative Screens Employed


Both Positive and Negative Screens

Some funds employ both negative and positive screens in their investment decisions. For example, while some funds will avoid firms which have a bad environmental record (negative screen), others will actively seek those firms which have an excellent environmental record or are involved in the environmental sector and the development of green technologies (positive screen).

Figure 8: Criteria Distribution – Positive and Negative Screening SRI Funds


Geographies

While most SRI funds are located in Europe and North America, nearly 50% follow a global-investing mandate while some funds are focused on Asia and developing markets. There are also some funds focussing specifically on African and Africa-investing firms.

Figure 9: Assets across Geographies


Manager Location

The SRI world can be split into European funds, which form 58% of the universe, and non-European funds. The charts that follow look at the differences between European SRIs and those from the rest of the world (RoW).

Figures 10a-10b: Fund Manager Locations by Number of Funds


Figure 11: Number of Criteria employed by SRI Funds
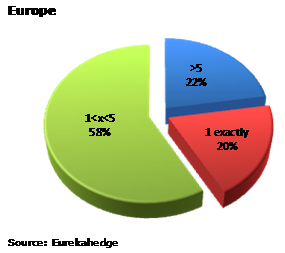


Among different SRI funds, there are those which are focused on particular issues, such as environmental issues only. However, the recent trend has been to add an increasing number of criteria to the screen potential investments. Figure 11 gives the breakdown of the number of criteria used by European managers and non-European managers while Figures 12 and 13 show what percentage of funds screen for particular criteria.

Figure 12: Criteria Breakdown - Europe


Figure 13: Criteria Breakdown – Rest of the World


Conclusion

Socially responsible investing is becoming more and more prevalent as the global focus on themes such as climate change and human rights increases. Investor sentiment has, over the years, changed from “maximising profits” to “maximising profits while investing in an ethical manner”. In addition to the swing in public opinion, other important contributing factors include legislative and government pressure, such as US President Obama’s support for the global fight against climate change, EU legislations on CSR and the latest EU Conference on Corporate Social Responsibility held in March 2010.

Furthermore, the criteria being employed for socially responsible investing are also increasing along with new schemes of investments, such as the microfinance in third world countries. While at this point, there is no industrywide set of rules and regulations for socially responsible investing (such as the compliance to Shariah board in Islamic funds), some funds have already started to adopt the UN Principles for Responsible Investments as a benchmark and going forward, this may become the standard practice as the industry matures.

While the performance of socially responsible funds has not matched that of absolute return vehicles such as hedge funds, it must be noted that they have outperformed the underlying markets over the last three years with less volatility in returns. Additionally, the increasing focus on CSR, which includes issues of transparency, effectively decreases the possibility of fraudulent activities being conducted by firms and hence, also serves as a tool for better risk management.

Going forward, we expect the SRI funds industry to continue attracting capital, with the number of funds continuing to increase. Also, we expect an increasing number of existing funds to adopt some sort of screening criteria in accordance with the rising demand from investors and legislatures.


Wednesday, June 30, 2010

2010 Key Trends in North American Hedge Funds

Introduction

After delivering excellent results in 2009, North American hedge funds continued the positive trend through the first few months of 2010. The Eurekahedge North American Hedge Fund Index advanced 4.40% in the January - April 2010 period, carrying on the momentum from last year when the sector delivered the best annual returns on record by gaining 23.72%.

We estimate the current size of the region’s hedge fund industry to be US$1 trillion in assets, managed by 4,451 funds, making up more than two-thirds of the global sector. Despite the losses and redemptions seen in 2008 and early 2009, this represents an annualised increase of 15.36% in the assets under management and 7.92% in the number of funds in the last decade.

Figure 1 below shows the growth of the North American hedge fund industry since 2000.

Figure 1: Industry Growth over the Years


As with hedge funds globally, North American managers also suffered from heavy redemptions in the August 2008 – April 2009 period, reaching a low of US$849 billion at the end of April 2009. However, the sector has rebounded remarkably since then, gaining more than US$50 billion in subscriptions and delivering more than US$100 billion through performance.


Industry Make-Up and Growth Trends

The following pages discuss the asset flows to the industry in greater detail while also looking at the changes in the industry over the years in terms of fund population, strategies employed, geographical mandates and manager locations.

Asset Flows

Table 1 shows the monthly changes in assets under management due to net flows and performance in North American hedge funds. Although the spate of redemptions triggered by the financial crisis continued until April 2009, the last 12 months have seen considerable capital being allocated to North American managers since then. In addition to net positive asset flows, the last 13 months also saw the funds post exceptional performance-based gains, bringing the total size of the industry back above the US$1 trillion mark as at end-April 2010.

In 2010, the first four months saw some healthy asset flows to the sector as investors took into account the excellent returns posted by managers in 2009. Furthermore, the considerable downturn protection potential offered by hedge funds has also figured into asset allocation decisions – the Eurekahedge North American Hedge Fund Index was down a palatable 9.43% in 2008 while global markets lost 40-60%. We believe that given the recent movements in global markets, this will increasingly have a bearing on investors’ allocations going forward.

Table 1: Monthly Asset Flows across North American Hedge Funds

Month
Net Growth (Perf)
Net Flows
Assets at End
Jan-08
-16.5
2.4
1175.4
Feb-08
11.9
12.4
1199.7
Mar-08
-18.7
22.8
1203.8
Apr-08
11.0
-8.0
1206.8
May-08
19.1
-0.4
1225.5
Jun-08
-0.1
21.8
1247.2
Jul-08
-25.9
7.3
1228.6
Aug-08
-15.6
-4.8
1208.2
Sep-08
-45.6
-21.6
1141.0
Oct-08
-36.9
-52.0
1052.1
Nov-08
-4.8
-29.3
1018.0
Dec-08
2.0
-44.9
975.1
2008
-120.2
-94.2
975.1
Jan-09
6.7
-63.2
918.6
Feb-09
-3.1
-12.6
902.8
Mar-09
-1.2
-25.6
876.1
Apr-09
7.5
-34.4
849.2
May-09
22.6
1.1
872.9
Jun-09
0.0
7.2
880.1
Jul-09
13.4
-0.4
893.1
Aug-09
7.9
10.9
911.9
Sep-09
16.7
13.3
941.9
Oct-09
0.5
5.1
947.5
Nov-09
11.1
4.5
963.1
Dec-09
6.4
-6.6
962.9
2009
88.5
-100.7
962.9
Jan-10
-1.3
-2.6
959.0
Feb-10
3.2
17.5
979.6
Mar-10
16.1
1.3
997.1
Apr-10
6.6
-0.8
1002.9


Table 1 shows a strong correlation between a month’s negative performance and net redemptions in the following one or two months and vice versa. Figure 2a illustrates this trend since December 2007, with the moving average of asset flows displaced by two months against the Eurekahedge North American Hedge Fund Index. The negative net flows corresponding to the dips in the index (September 2008 - March 2009) clearly demonstrate this trend; however, whether this is simply a statistical manipulation or truly suggests that investors are ‘trend-following’ is open to some debate.

Figure 2a: Eurekahedge North American Hedge Fund Index vs Displaced Moving Average Net Flows


Figure 2b: Monthly Asset Flows to North American Hedge Funds vs North American Funds of Hedge Funds

Funds by Size

Although the current composition of North American hedge funds in terms of fund sizes is similar to that in 2005, the sector did witness significant changes through the years. As shown in Figure 3, the number of funds managing more than US$100 million grew steadily from 2005 until mid-2008 as stable returns and healthy asset flows for most of this period helped funds progressively outgrow their initial AuM ranges. This trend was, however, reversed as the financial crisis took its toll on the regional managers.

In the April 2008 - April 2009 period, the number of funds with more than US$500 million in assets declined by more than half,  while the number of funds with less than US$50 million increased to account for more than two thirds of the region’s hedge funds amid performance-based losses and widespread redemptions. However, the increase in the number of smaller hedge funds (US$20 million or less) is also caused by a significant number of funds which were started in 2009 by professionals who left investment banks, proprietary trading desks and other financial institutions.

Figure 3: Changes in the Composition of the Fund Population by Fund Sizes (in US$ million)


Funds by Investment Strategy, Investment Region and Head Office Location

Investment Strategy
In terms of funds by strategic mandates, while long/short equity managers continue to hold the greater proportion of assets, their share of the pie has decreased from 42% in 2006 to 31% in 2010, attributed to the following reasons:


·          Risk aversion triggered by the credit crunch in 2007, which led to a flight of ‘safer’ capital  asset classes

·          Performance based-losses through the financial crisis, which were further aggravated by the ban on short-selling imposed by regulators in 2008

·          Heavy redemptions from panicked investors at the end of 2008, which had the additional knock-on effect of forcing managers to liquidate potentially winning positions

An additional point to note is that during the financial crisis, performance-based losses of long/short managers were greater than those of other strategies, North American long/short managers’ lost 16.7% during 2008 while the average North American hedge fund was down 8.9%.

CTA/managed futures and event driven hedge funds increased their share of North American hedge fund assets. CTA managers have attracted significant capital throughout 2009 as investors look to diversify from traditional asset classes. Furthermore, the strong performance of CTA/managed futures managers in 2008 (up 27.78%) contributed to the increase in their share of the pie while also drawing strong capital flow during 2009.

Event driven hedge funds have doubled their share from 6% of North American assets in 2006 to 12% in 2010. The funds have attracted increasing interest from investors over the years while record returns in 2009 delivered significant performance-based growth. The Eurekahedge Event Driven North American Index gained 52.73% last year – the best annual returns on record across all strategies in North American hedge funds.


Geographical Mandate

The North American hedge fund industry can broadly be classified into two geographical investment mandates: North America-investing funds and globally investing funds. While the sector continues to be dominated by North American mandated funds, global funds have increased their share of the asset over the last few years as investors seek greater geographical diversification as well as exposure to regions that are expected to generate greater economic growth. Furthermore, macro-investing funds and CTA/managed futures funds (both of which employ a global geographical mandate) delivered 22.46% and 27.78%, respectively, in 2008, while all other strategies were negative, hence delivering substantial performance-based asset growth. The 2008 performance also generated greater interest in the funds, with managers subsequently attracting significant amounts of capital in 2009.

Figures 4a-4b: Changes in Geographical Mandate by Assets under Management


Manager Location

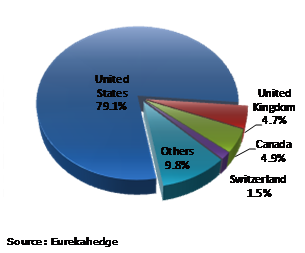
The United States, being the oldest hedge fund centre with the biggest market and largest number of investors and service providers, remains the location of choice for most North American hedge funds. While the share of the US had dropped to 77% in 2009, strong start-up activity in the last six months has brought it back up to 79%. Going forward, we expect to see the proportion of funds located in the US to go beyond 80% by the end of 2010.

Figure 5: Manager Location by Number of Funds


Administrators

The hedge fund administration landscape in North America, as shown in Tables 2a-2b, is very competitive as 40% of the market is made up by small players. While there is an increased demand for hedge fund administration and a growing number of hedge fund launches, the industry has its fair share of difficulties. Administrators who service private equity and hedge funds are seeing tougher times as private equity deal flow has slowed down in recent years. With the heightened focus on regulations and transparency, hedge funds are taking fund administration more seriously by looking at the quality of service administrators can provide for their investors.


Tables 2a-b: Top Administrators by Assets under Management

2008
2010
Administrator
Market Share (%)
Administrator
Market Share (%)
CITCO
16.5%
CITCO
18.4%
HSBC
8.8%
Citibank
9.0%
Citigroup
8.6%
HSBC
8.8%
Bank of New York
8.2%
State Street
8.3%
State Street
5.5%
Custom House
4.5%
Custom House
3.9%
Goldman Sachs
3.3%
Fortis
3.5%
GlobeOp
3.1%
Goldman Sachs
2.8%
BNY Mellon
3.1%
IFA
2.2%
SEI Investment Services
3.1%
Others
40.2%
Others
38.6%


Fees

Table 3 shows the changes in the average management and performance fees of new North American hedge funds launched over the last six years. Although average annual management fees have not changed significantly as they are reasonable and competitive with the fees charged by other investment vehicles like mutual funds, there was a significant change in the average performance fees of North American funds launched in 2009. However, the industry seems to be reverting back to the 2/20 standard in 2010 as the strong performance and asset flows seen over the last year have increased the demand for hedge funds.

Table 3: Changes in Fee Structure of Start-Ups over the Years

Year
Average Performance Fees (%) of Launches
Average Management Fees (%) of Launches
2004
19.60
1.57
2005
19.92
1.69
2006
19.47
1.66
2007
20.35
1.63
2008
19.14
1.57
2009
17.96
1.69
April 2010
19.03
1.51


Funds Offering Managed Accounts

Another significant change seen in North American hedge funds is the increase in the number of funds offering managed accounts. With concerns of liquidity and transparency gaining greater importance, investors see separate managed accounts providing them with greater control over their assets. While managed accounts were earlier perceived as diluting the overall performance of a fund, the counter argument of greater control, risk management and protection against losses is gaining more ground. Furthermore, hedge funds have been increasingly flexible in meeting the demands of investors since the financial crisis. The study conducted by Eurekahedge on more than 1,500 North American hedge funds confirms this trend. Table 4 shows how the percentage of new launches offering managed accounts has changed over the years in the North American hedge fund sector.


Table 4: Percentage of New Launches Offering Managed Accounts per Year

2005
2006
2007
2008
2009
2010
33.6%
34.8%
42.7%
51.6%
52.0%
50.0%


Performance Review

North American hedge funds have delivered consistent risk-adjusted returns over the years while also outperforming other comparative investment vehicles as well as hedge funds in other regions. The Eurekahedge North American Hedge Fund Index rose 23.76% in 2009 – the highest annual returns on record since the index’s inception in December.

Figure 5 tracks the performances of North American hedge funds and other investment classes since 2005 and clearly shows that hedge funds have delivered 40% higher returns than funds of funds and more than 50% higher returns than the MSCI North American Index over the last five years.


Figure 5: Performance of North American Hedge Funds vs Other Alternative Investment Vehicles (since 2006)


The performance statistics in Table 5 shows that North American managers also fared better than other investment vehicles in the three-year window, delivering higher annualised returns with lower volatility and the lowest drawdown.


Table 5: Performance of North American Hedge Funds vs Other Alternative Investment Vehicles

Eurekahedge North American Hedge Fund Index
Eurekahedge North America Fund of Funds Index
Eurekahedge North America Absolute Return Fund Index
MSCI North American Index
12-Month Returns
22.42%
15.35%
34.05%
35.20%
3-Year Annualised Returns
8.09%
-0.01%
-1.49%
-6.55%
3-Year Annualised Standard Deviation
7.15%
7.61%
15.21%
19.87%
Sharpe Ratio (RFR = 4%)
0.57
-0.53
-0.36
-0.53
Maximum Drawdown (3 Years)
-12.47%
-20.33%
-38.82%
-51.51%


Regions

Figure 6: Hedge Fund Performance by Geographical Mandate


Over the past three years, North American managers were consistently the best performers across all major hedge fund regions, and they managed this feat even with the highest Sharpe ratio. While most other regional managers largely funnel into long/short equities, North American managers are well-diversified in all hedge fund strategic mandates, thereby significantly lowering the volatility of the average fund.

Among all regions, North American hedge funds performed the best in 2008, losing only 9.41% on average, thereby proving their downturn protection credentials. Furthermore, North American managers delivered the second-best performance in 2009 among the different regional mandates, displaying their ability to catch most of the upside in rallying market conditions.

Table 6: Hedge Fund Performance by Geographical Mandate

Eurekahedge North American Hedge Fund Index
Eurekahedge European Hedge Fund Index
Eurekahedge Asia ex Japan Hedge Fund Index
Eurekahedge Japan Hedge Fund Index
3-Year Annualised Returns
8.09%
1.01%
7.20%
0.42%
3-Year Annualised Standard Deviation
7.24%
8.58%
14.05%
7.32%
Sharpe Ratio (RFR = 4%)
0.57
-0.35
0.23
-0.49
Maximum Drawdown (3 Years)
-12.47%
-21.46%
-30.33%
-16.70%
% Below HWM
0.00%
0.00%
0.00%
-0.95%
2010 YTD Returns
4.40%
4.16%
1.80%
7.41%


Strategies

Figures 8a-8b: Performance of North American Hedge Funds by Strategic Mandate


Table 7: Hedge Fund Performance by Geographical Mandate


EH
North America Arbitrage Hedge Fund Index
EH
North America CTA / Managed Futures Hedge Fund Index
EH
North America Distressed Debt Hedge Fund Index
EH
North America Event Driven Hedge Fund Index
EH
North America Fixed Income Hedge Fund Index
EH
North America Long / Short Equities Hedge Fund Index
EH
North America Macro Hedge Fund Index
EH
North America Multi-Strategy Hedge Fund Index
EH North America Relative Value Hedge Fund Index
12-Month Returns
20.81%
10.98%
52.34%
41.52%
26.37%
22.14%
9.95%
19.21%
26.71%
3-Year Annualised Returns
8.79%
18.47%
5.78%
5.67%
5.85%
4.85%
17.13%
9.03%
7.64%
3-Year Annualised Standard Deviation
6.31%
8.50%
11.96%
14.87%
7.22%
9.23%
8.20%
6.12%
7.99%
Sharpe Ratio (RFR = 4%)
0.76
1.70
0.15
0.11
0.26
0.09
1.60
0.82
0.46
Maximum Drawdown
(3 Years)
-11.42%
-2.78%
-31.16%
-30.46%
-15.91%
-19.32%
-4.42%
-10.46%
-14.35%


North American managers employing the distressed debt strategy have dwarfed the returns of all other strategic mandates over the last 12 months as investors continue to inject more capital into distressed securities. The Eurekahedge Distressed Debt North American Hedge Fund Index gained 52.34% in the last 12 months on the back of upbeat market sentiment over the asset class. With default rates down to 9.1% at the end of April 2010 and is expected to decline 3% by the end of the year, we expect distressed debt managers to continue this healthy run for the rest of the year.

CTA managers, who were the best performers in 2008, achieved the highest returns in three years’ time period (Table 7) in spite of a challenging start to 2010 as the market conditions were difficult for most of the trend followers. Macro-investing funds have also delivered consistent returns over the last three years, closely trailing behind CTA/managed futures funds in all statistical measures.

In Closing

After suffering heavy withdrawals, witnessing some high-profile frauds and facing tremendous pressure from regulatory authorities, the North American hedge fund sector has adapted to the changed landscape remarkably well. The changes observed in the fee structures, prime broker landscape, administrator space and regulatory front are evidence of an industry that is proactive and committed to delivering the greatest benefit to stakeholders.

This was further demonstrated by managers in 2009 by delivering the best returns on record for the Eurekahedge North American Hedge Fund Index, gaining 23.78% during the year. The positive performance trend has continued through the first few months of 2010 while the asset flows to the sector have also been substantial as predicted by Eurekahedge in January 2010[1].

Going forward, we expect North American managers to outperform underlying markets in 2010 while also attracting significant capital from investors at the end of the year, with assets peaking at US$1.1 trillion.