Showing posts with label asian. Show all posts

Wednesday, June 19, 2013

The Eurekahedge Report - June 2013

The benchmark Eurekahedge Hedge Fund Index was up 0.40%1 in May while the MSCI World Index was down 0.45%2 over the month. Total assets under management were up by US$3.06 billion during May – the sector witnessed net positive asset flows of US$4.59 billion while losing US$1.53 billion through performance-based losses. The total size of the industry now stands at US$1.88 trillion.
Highlights of hedge fund performance and asset flows for the month are as follows:
May 2013
US$ billion
Allocation (Inflows)
35.85
Redemption (Outflows)
-31.26
Net Asset Flows
4.59
Positive Performance (Growth)
5.02
Negative Performance (Decline)
-6.55
Total
-1.53
Overall Total
3.06

To read more, please see full Eurekahedge Report, also accessible on Scribd & Issuu.

Thursday, June 13, 2013

Hedge funds attract US$50 billion in five months

Hedge funds attract US$50 billion in five months
Hedge funds witnessed the seventh consecutive month of positive returns in May amid mixed returns in global markets. The Eurekahedge Hedge Fund Index was up 0.20%1 during the month, while the MSCI World Index2 was down 0.45% in May.
Key takeaways for the month of May 2013:
  • Hedge funds witnessed the 5th consecutive month of net allocations and 7th consecutive month of positive returns - up 3.89% year-to-date
  • Total asset flows for 2013 currently stand at US$50 billion with total size of the industry at US$1.87 trillion
  • Asia ex-Japan hedge funds outperformed underlying markets for three consecutive months - up 3.26% since end-February
  • Eurekahedge is currently tracking almost 500 funds that have delivered more than 15% year-to-date and 250 funds that are up by over 20% year-to-date
  • Distressed debt funds extended winning streak to 11 consecutive months, gaining 21% since end-June 2012
  • CTA/managed futures funds declined by 1.69% in May 2013

To read more, please see the full Eurekahedge Index Flash, also accessible on Scribd and Issuu.

Tuesday, May 21, 2013

The Eurekahedge Report - May 2013

Hedge funds posted positive returns in April, amid divergent trends in global markets. The benchmark Eurekahedge Hedge Fund index was up 0.87%1 while the MSCI World Index was up 2.02%2 over the month. Total assets under management were up by US$19.87 billion during April – the sector witnessed net positive asset flows of US$7.13 billion while witnessing profits of US$12.75 billion through performance-based gains. The total size of the industry now stands at US$1.87 trillion.

Highlights of hedge fund performance and asset flows for the month are as follows:
April 2013
US$ billion
Allocation (Inflows)
18.78
Redemption (Outflows)
-11.65
Net Asset Flows
7.13
Positive Performance (Growth)
14.91
Negative Performance (Decline)
-2.16
Total
12.75
Overall Total
19.87


To read more, please see full Eurekahedge Report, also accessible on Scribd & Issuu.

Tuesday, May 14, 2013

Hedge funds continue on positive track, global index up 4%

Hedge funds posted positive returns in April as most markets trended upwards during the month. The Eurekahedge Hedge Fund Index was up 1.09%1 during the month, while the MSCI World Index2 gained 2.02% in April.
Key takeaways for the month of April 2013:
  • Japanese hedge funds witnessed strongest April and 4-months on record returns, gaining 4.22% and 15.87% respectively
  • The Eurekahedge Billion Dollar Hedge Fund Index is up 4.01% April YTD with total assets standing at US$253 billion
  • Asia ex-Japan hedge funds outperformed underlying markets for second consecutive month
  • Eurekahedge is currently tracking more than 250 funds that have delivered over 15% year-to-date
  • Distressed debt funds extend their winning streak to 10 months, gaining 23% since July 2012
  • The asset-weighted Mizuho-Eurekahedge Asia Pacific Index was up 6.89% in April YTD

To read more, please see the full Eurekahedge Index Flash, also accessible on Scribd and Issuu.

Tuesday, May 29, 2012

Press release: All the winners from the Asian Hedge Fund Awards 2012

SINGAPORE (May 28, 2012) - The Asian Hedge Fund Awards 2012 took place on 25th May 2012, marking another year of success as Eurekahedge celebrated the best of the Asian hedge fund industry. With 320 hedge fund players in attendance, Eurekahedge gave credit to the top achievers of 2011 and 1Q 2012 and were pleased to welcome many new faces among this year’s event.

A total of 15 awards were presented on the night, and Segantii Asia-Pacific Equity Multi-Strategy Fund took centre stage by winning the coveted award of Best Asian Hedge Fund in addition to Best Asian Multi-Strategy Hedge Fund.

The remaining awards for top performers in the region went to Nezu Japan Fund for Best Japan Hedge Fund, Tairen China Fund for Best Greater China Hedge Fund, CC Asia Absolute Return Fund for Best Asia ex-Japan Hedge Fund and Alithion Japan Fund for Best Singapore Hedge Fund.

Key highlights of this year’s awards were Fortress Asia Macro Fund who took the stage for Best New Asian Hedge Fund and Peter Fletcher’s acceptance of the Special Achievement Award – awarded in recognition of Mr. Fletcher’s influence on the Asian hedge fund industry since the 1990s, as well as his work in founding the Rice charity.

Other big winners included Ortus Fund for Best Asian FX Investing Fund, BIA Pacific Macro Fund for Best Asia-based Global Macro Fund, Pengana Asia Special Events Fund for Best Asian Event Driven Fund, Regal Amazon Market Neutral Fund for Best Asian Relative Value Fund, Monsoon Asia-Pacific Systematic Program for Best Asia-based CTA/Managed Futures Fund, MNJ Asia-Pacific Absolute Return Fund for Best Asian Quant Fund and Sensato Asia Pacific Master Fund for Best Asian Long/Short Equity Fund.

Eurekahedge’s partnership with the charity Rice this year saw SGD$44,000 being raised through a charity auction. This amount will be dedicated towards Rice’s philanthropic efforts in improving the lives of children across Asia via their respective charities. Eurekahedge would like to thank all winning bidders for their contributions in supporting this cause.

Eurekahedge would also like to take this opportunity to thank their many sponsors, participants, delegates and judges who were committed to the success of this year’s awards. The company remains committed to celebrating the industry’s successes and hopes to welcome all of this year’s attendees back in 2013 – after what is sure to be an eventful year!


About Eurekahedge
Founded in 2001, Eurekahedge is an independent financial data and research company focusing on alternative investments. Eurekahedge maintains coverage on over 26,000 alternative funds globally and its research covers hedge funds, funds of funds, UCITS III hedge funds, private equity funds, Islamic funds, real estate funds, SRI funds and long-only absolute return funds.

In addition to fund data Eurekahedge publishes over 100 alternative investment benchmark indices along with the monthly Eurekahedge Report covering asset flows, fund performance, macroeconomic trends, league tables and specific index returns on the hedge fund industry.

For further information, please contact:

Contact Details
Sultan Arif
Head of Marketing and Corporate Communications
sultan[@]eurekahedge[.]com
+65 6212 0930

Eurekahedge Pte Ltd, Level 4
101C Telok Ayer Street
Singapore
068574
+65 6212 0900
www.eurekahedge.com

###

Tuesday, October 18, 2011

2011 Key Trends in Asian Hedge Funds

Introduction

Asian hedge funds have witnessed remarkable growth over the last decade in terms of both fund population as well as assets under management (AuM). As at August 2011 the total AuM in Asian hedge funds stood at US$135 billion; nearly six times that as of end-2000 while the number of funds increased more than six fold in that same period.

Although assets managed by Asian hedge funds peaked in 2007 at US$176 billion, the size of the region’s hedge fund industry was hit by the combined effect of redemptions and performance-based losses through the global financial crisis causing AuM to fall to US$105 billion in April 2009.

Figure 1: Industry growth since 1999


Since April 2009 the industry has witnessed healthy growth, gaining nearly US$31 billion over a period of 28 months. During this time the Eurekahedge Asian Hedge Fund Index has gained 27.4% leading to performance- based gains of more than US$15 billion. Record performance in 2009 also encouraged investors to allocate capital to the regional hedge funds. Over the last 12 months the sector has attracted nearly US$11 billion through net positive asset flows.


Asset flows

Table 1 details the monthly changes in AuM from January 2009 to 2011 YTD. In the first half of 2009, Asian hedge funds continued to witness heavy redemptions from investors, losing a total of US$26 billion. As managers started to post healthy gains on the back to rallying underlying markets, investor sentiment improved and the sector witnessed some net positive asset flows in 2H 2009.

Asian hedge funds started 2010 with expectations of strong inflows based on excellent 2009 returns and healthy allocation activity seen at the end of 2009. However after an initial period of profit-taking and portfolio rebalancing, a norm at the start of the year, most investors withheld allocations until the second quarter of the year amid concerns over European debt contagion spreading to emerging markets and Asia. Investor sentiment improved from May 2010 and since then the sector has gained US$12.8 billion through net positive asset flows.

Table 1: Monthly asset flows in Asian hedge funds

Month
Net Growth (Performance)
Net Flows
Assets at end
Jan-09
0.1
(9.1)
117.4
Feb-09
(0.2)
(4.7)
112.5
Mar-09
0.6
(4.6)
108.5
Apr-09
1.3
(5.1)
104.8
May-09
3.6
(2.6)
105.8
Jun-09
0.4
(0.2)
106.0
Jul-09
1.6
0.5
108.1
Aug-09
(0.2)
1.7
109.6
Sep-09
1.0
1.2
111.9
Oct-09
(0.0)
2.8
114.6
Nov-09
0.9
1.0
116.5
Dec-09
0.9
(0.1)
117.3
2009
10.1
(19.1)
117.3
Jan-10
(1.2)
(0.6)
115.6
Feb-10
(0.2)
(0.7)
114.7
Mar-10
2.2
(0.1)
116.8
Apr-10
0.9
(0.4)
117.3
May-10
(2.4)
0.7
115.5
Jun-10
(0.3)
0.4
115.6
Jul-10
1.1
0.5
117.1
Aug-10
0.4
0.4
117.9
Sep-10
2.8
0.5
121.1
Oct-10
1.8
1.9
124.8
Nov-10
0.2
0.7
125.7
Dec-10
2.0
0.8
128.6
2010
7.2
4.0
128.6
Jan-11
(0.5)
0.3
128.3
Feb-11
(0.1)
1.6
129.8
Mar-11
0.8
0.3
130.8
Apr-11
1.7
1.1
133.6
May-11
(1.2)
2.1
134.5
Jun-11
(0.9)
0.7
134.3
Jul-11
1.3
0.5
136.1
Aug-11
(1.2)
0.4
135.3


Note: all figures are in US$ billion                           Source: Eurekahedge


Launches and closures

After witnessing a high attrition rate in the 2H 2008 to 1H 2009, the population of Asian hedge funds has reverted back to a healthy growth trend. A total of 351 new funds have been launched since July 2009, as opposed to 236 fund closures. While launch activity has been encouraged by healthy performance of Asian hedge funds and strong growth in the underlying markets, attrition rate has fallen due to reduced redemption pressure as well as an increasing number of managers having been able to meet their high watermarks, and hence generate performance fees.

Figure 2: Launches and closures across Asian hedge funds


High watermark

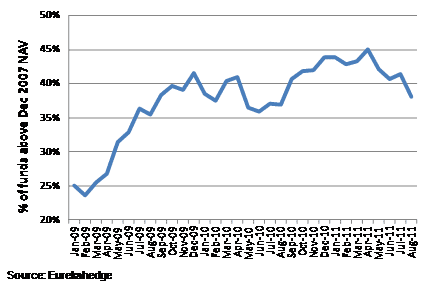
As the high watermark differs from investor to investor depending on the net asset value (NAV) level at the time of capital allocation, we take the NAV of funds at December 2007 as the starting point for this analysis to determine if they are above their high watermarks.

Figure 3: Percentage of managers above 2007 December NAV


Fund Size

The current distribution of fund population according to AuM shows a significant difference from four years prior due to the strong directional trends in performance, heavy redemptions and high attrition rate suffered by the industry through the financial crisis. The percentage of funds managing US$50 million or less has increased from 54% in 2007 to 64% in 2011, suggesting that new launches have not attracted much capital and most of the allocations witnessed since 2H 2009 have gone to larger funds.

Figures 4a-4b: Breakdown of fund population by fund size


Geographic mandates

In terms of geographic investment mandates, the assets invested in globally mandated funds have witnessed the greatest growth. As globally investing funds did not suffer losses of the same extent as other Asian hedge funds in 2008, most of the capital allocated to hedge funds over the last two years came from institutional investors who prefer to invest in large global-mandated funds to gain exposure to Asia. The drop in the share of Asia including Japan and Japan focused funds, is primarily due to the closure of a few large funds over the last four years as well as the greater relative growth of global and China investing funds.

Figures 5a-5b: Geographic mandates by AuM

Strategic mandates

The most important trend here has been the decline in the share of long/short equity funds. The Asian hedge fund space was initially dominated by long/short equity hedge funds as it was the easiest implemented strategy that investors have traditionally been most comfortable with. However, easing of restriction in markets such as China and India, greater access to the markets and the growing availability of more complex financial instruments in Asian markets, has led to an increasing number of funds that employ different strategies. Additionally, long/short equity funds lost a major chunk of assets through the financial crisis due the rapid decline in equity markets globally.

Figures 6a-6b: Strategic mandates by AuM


Head office locations

The distribution of Asian hedge funds population by head office location also shows some significant trends that point to a maturing industry. In 2007, 40% of the funds were managed out of the UK and the US, as these were the traditional hedge fund centres. Over the last four years however, Hong Kong and Singapore have gained substantial market share from New York and London. The continued expansion of service providers in Asia, proximity to region of investment, and an increasingly large financially trained workforce have helped this move towards Asian-based funds.

Figures 7a-7b: Head office locations by number of funds


Prime brokers

Tables 2a and 2b display the breakdown of Asian hedge funds assets according to their 2007 and 2011 prime brokers[1]. The trend shows more equitable distribution of assets across the top 10 prime brokers as managers have started to use more than one prime broker as a measure to manage counterparty risk. The decreasing share of ‘Others’ also shows that funds prefer to work with larger, renowned and financially stable prime brokers in the post-Lehman world. New prime brokerages in the region have found it hard to break into the hedge fund business, and as such they have targeted niche sectors and the smaller hedge funds to gain a foothold in the sector.

Tables 2a-2b: Top prime brokers by market share

2007
Prime Broker
Market Share
Goldman Sachs
26.49%
Morgan Stanley
26.62%
UBS
9.15%
Deutsche Bank
7.50%
Credit Suisse
6.60%
Citigroup
3.23%
Merrill Lynch
3.77%
Bear Stearns
9.13%
Fimat
0.53%
Others
6.98%
August 2011
Prime Broker
Market Share
Goldman Sachs
28.41%
Morgan Stanley
24.38%
UBS
13.24%
Deutsche Bank
8.87%
Citibank
8.30%
Credit Suisse
4.56%
Bank of America Merrill Lynch
4.40%
Newedge
2.35%
Barclays
2.10%
Others
3.38%

Source: Eurekahedge                                                         Source: Eurekahedge


Administrators

The trend towards more diversification within the larger service providers is also apparent in the breakdown of hedge fund assets by administrators. HSBC continues to take the top spot as the largest Asian hedge fund administrator by market share - however the percentage share has fallen from 32.17% to 19.12% over the last four years. State Street has increased its share significantly with increased focus on Asia as well as the acquisition of Mourant International Finance Administration. The most noteworthy trend is the near 10% drop in the share of assets administered by ‘Others’, which includes in-house administration. The primary reason for this shift is the emphasis on regulations and transparency as no investor is willing to invest with managers lacking proper risk controls in place and reputed third-party administrators.

Tables 3a-3b: Top administrators by market share

2007
Administrator
Market Share
HSBC
32.17%
CITCO
10.76%
State Street
4.94%
Citigroup
4.11%
Goldman Sachs
3.36%
PNC
2.91%
JP Morgan
2.40%
Morgan Stanley
2.03%
Fortis
1.98%
Northern Trust
1.95%
Others
33.38%
August 2011
Administrator
Market Share
HSBC
19.12%
CITCO
11.97%
State Street
11.89%
RBC Dexia Investor Services
9.81%
Morgan Stanley
7.19%
GlobeOp
4.32%
Citibank
3.57%
Goldman Sachs
2.93%
JP Morgan
2.70%
Meridian Fund Services
2.47%
Others
24.01%

Source: Eurekahedge                                                       Source: Eurekahedge


Performance review

The performance of Asian hedge funds against the underlying markets and other alternative investments is seen in figure 8. Asian hedge fund managers outperformed Asian funds of funds and Asian long-only absolute return funds over the last five years. During the financial crisis in 2008 to 2009, the long-only index shed the most percentage points with a 51.15% drop from peak to trough while Asian hedge funds lost a maximum of 30.98%, displaying better downturn protection. Asian long-only funds also have a high beta with underlying markets as opposed to Asian hedge funds. When compared against the MSCI AC Asia Pacific Index, long-only funds registered a beta of 0.86 while hedge funds had a beta of 0.41 over the last five years.

Figure 8: Performance of Asian hedge funds vs. other investments since 2006


Within Asia, hedge funds allocating to Greater China have been the most profitable over the last three years with returns of 38.92%. In comparison, the Shanghai Composite Index only gained 9.21% in the same period of time. Funds investing in developed markets in the region; Australia/New Zealand and Northeast Asia have delivered more consistent performance recently.

Figure 9: Performance of Asian hedge funds across geographic mandates


Table 4: Performance of Asian hedge funds across geographic mandates

Asia
Asia
ex-Japan
Australia/
New Zealand
Greater China
India
Japan
Korea
Taiwan
2011 YTD returns
-2.88%
-4.94%
-2.63%
-4.97%
-12.75%
-0.30%
-2.09%
-4.08%
12 month returns
5.56%
4.79%
11.96%
6.03%
-6.76%
6.73%
6.56%
4.47%
3 year annualised returns
6.53%
8.06%
8.79%
11.58%
3.20%
3.68%
4.17%
2.09%

Source: Eurekahedge


All strategies delivered positive returns over the last 12 months as well as in the long term. Event driven hedge funds gained 14.20% in 12 months on the back of a robust corporate activity environment which has provided significant opportunities for managers. Total M&A deals during the first nine months of 2011 reached a staggering US$419.2 billion[2] within the Asia ex-Japan region, an increase of 16 percent in comparison to the January to September 2010 period. CTA Asian hedge funds also delivered excellent performance, locking in a total return of 34.40% over three years, outperforming the average Asian hedge fund by 13.51% in absolute terms. Regional long/short equity managers delivered a three year total return of 19.81%, beating the global average long/short equity fund’s performance by 5.5 percentage points.

Figure 10: Performance of Asian hedge funds across strategic mandates


Table 5: Performance of Asian hedge funds across strategic mandates

Arbitrage
CTA/
managed futures
Distressed debt
Event driven
Fixed income
Long/
short equities
Macro
Multi-strategy
Relative value
2011 YTD returns
-0.66%
3.05%
1.65%
4.00%
3.60%
-3.87%
1.28%
-0.46%
-2.43%
12 month returns
3.67%
10.98%
10.29%
14.20%
8.34%
5.04%
3.00%
6.29%
2.00%
3 year annualised returns
4.20%
10.36%
4.88%
8.99%
6.07%
6.21%
7.31%
6.00%
8.87%

Source: Eurekahedge


[1] Prime broker market share is calculated using the AUMs of the funds that supply their data to the Eurekahedge database. If the funds supply us with lists of multiple prime brokers that service them then the AUM is distributed equally amongst the prime brokers listed for the fund.
[2] According to Dealogic